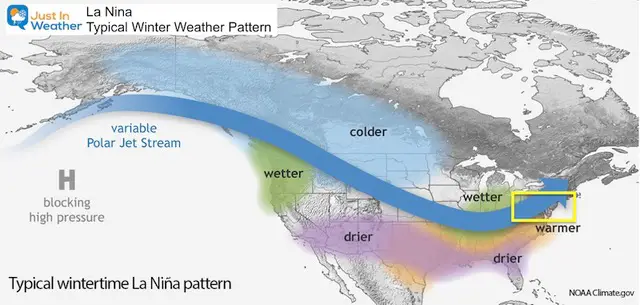
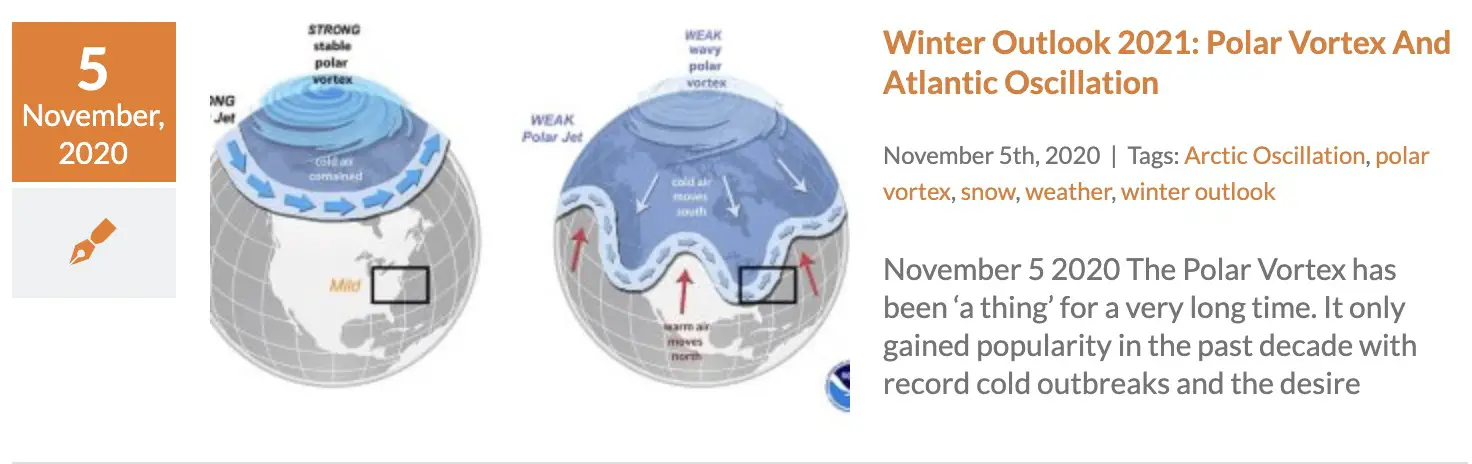
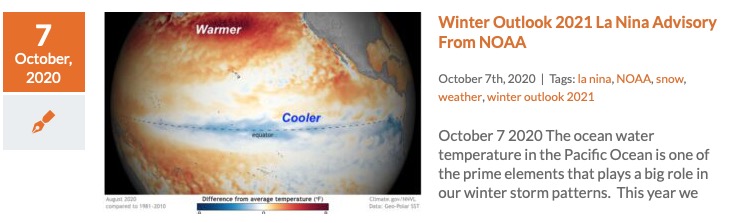
La Nina Winter Weather Pattern
The storm track from the Pacific Ocean tends to take a northern route, diving across the central plains, then up the Ohio Valley.
I want to emphasize that this is the NOAA map for a ‘typical La Nina’ storm pattern. It is not static for the entire season.
I put the yellow box over the Mid Atlantic. We are in a region that can be on the edge of the storm track. There are other factors that can shift this south and colder for us, or west and warmer. It is possible to average a warm pattern, and still get a few strong cold storms.
La Nina Winter History: Baltimore
These state generated from the National Weather Service are not supportive of a snowy winter. The caveat is that this is only from 1950 to 2017. There are quality weather records back to 1882. But the La Nina years historically are more extrapolation, since that pattern was not thoroughly studied by scientists then.
However, within this data there are exceptions and other factors that may not have teamed up together before. I will continue to explore them for my formal outlook.
Important To Note:
La Ninas are not all the same. The intensity ‘weak’, ‘moderate’, and ‘strong’ can yield different results for our region.
Video: La Nina Explained
From NOAA’s National Ocean Service


Temperatures
Warmer than normal 65% of the La Nina Winters.
Cooler than normal 35% of La Nina Winters.
- Weak La Nina is even chances.
- Moderate La Nina is most likely to bring colder temperatures.
Precipitation
This is total precipitation for rain and snow.
Overall there is an even split. But this chart can be confusing. A Moderate La Nina has had 4 of 6 times been below average, but the chart has the largest total. This is because when there is an above average pattern, it can be WAY ABOVE AVERAGE to offset the total comparison.
Snowfall
If you have Faith in the Flakes, this might not be what you want to see. But there is a silver lining. While most years show below normal snow, there have been some big exceptions.
- 1996- January Blizzard was in a La Nina year. This also accounted for most of the snow that winter.
- 2000 – Most of snowfall that winter was in a 10 day period between January 20 and 30. This included the ‘surprise’ Nor’easter that brought 14.9″ of snow to BWI on January 25.
Take Away:
If you don’t want snow, La Nina historically has been your friend.
But if you have FITF, all is not lost. There have been years with big snow storms during a La Nina. Also, there are other elements at play. That is what I explore and try to fit together. This is not scientific law, only one theory. Correlation is NOT causation! It is possible that this winter may have a new combination of global influence to bring us something unprecedented. Besides, these numbers above are only a sample of 77 years. There may have been more supportive data in prior years.
All Winter Weather Resource Pages
Recent Articles
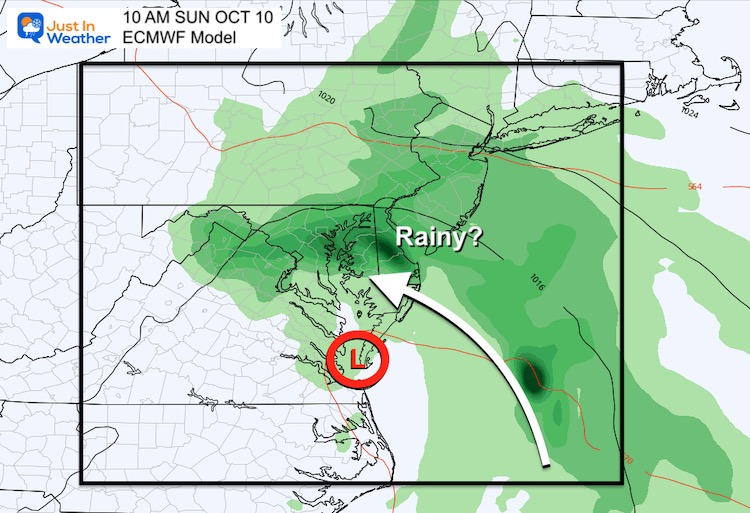
October 7 A Break Today But Weekend May Bring Rain From Coastal Storm
Thursday October 7 This morning we have already seen a
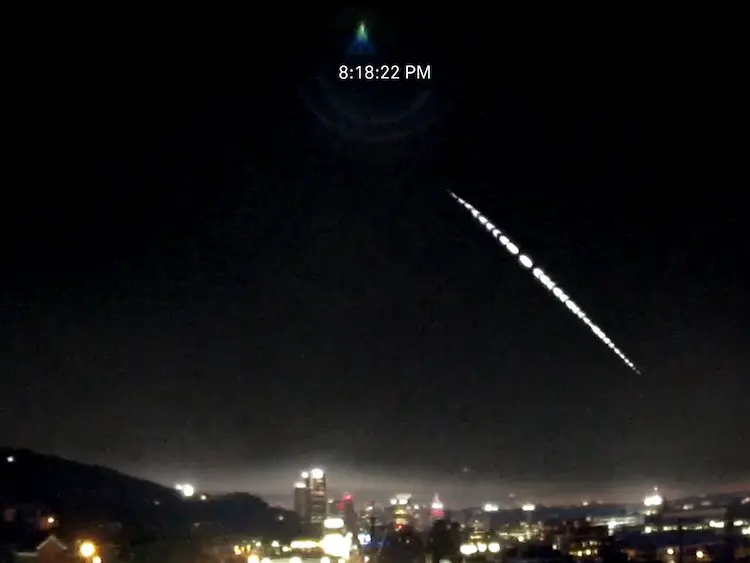
Fireball Video Over Pittsburgh Tuesday Evening October 5 2021
Wednesday October 6 2021 On Tuesday evening, a fireball was
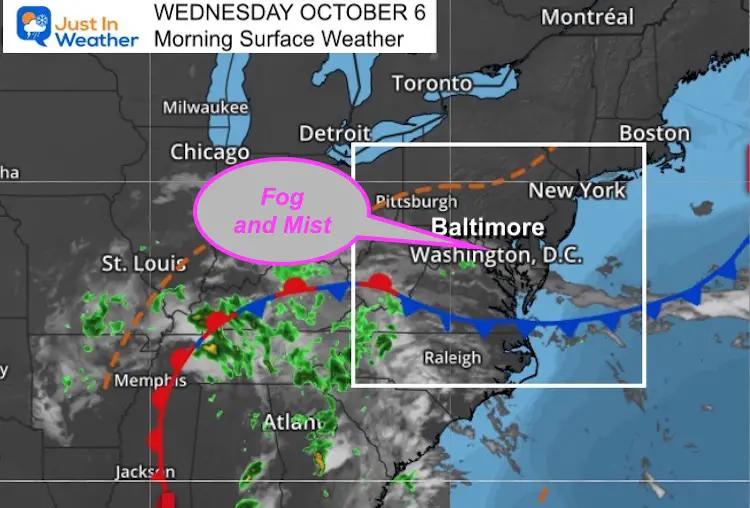
October 6 Weather Still Warm And Damp Tracking Narrow Band Of Rain
Wednesday October 6 This morning begins with fog and mist.
Please share your thoughts, best weather pics/video, or just keep in touch via social media
Facebook: Justin Berk, Meteorologist
Twitter: @JustinWeather
Instagram: justinweather
Winter Outlook Series
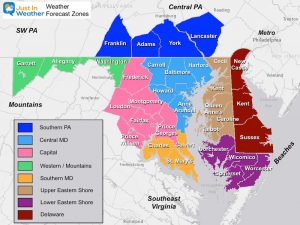
14 Local Maryland Pages (and York PA)
We have made a page for Maryland Weather which gives you the current conditions for 14 present area locations.
FITF Shop Open
My ‘bonus’ daughter Jaiden and wife showing off our popular Maryland Hoodies. Unisex and women’s items all produced in Maryland.
Click here to see this and many other new items.


Also see:
Maryland Weather Page
I wanted to keep it simple. Just the basics for a quick view at any time.

Just In Power Kids:
A portion of proceeds go to our programs Providing FREE holistic care for kids in cancer treatment and up to 5 years post treatment and caregivers.
![]()
New Caps and Hats