The Atlantic Ocean and Caribbean Sea make up the entire Atlantic Basin for meteorological purposes. The official start of the Hurricane (tropical) season is on June 1 each year, ends lasts through November 30. But occasionally a storm may form in the month of May.
Increase In Storms With Warmer Water
Warm water at least 78ºF is needed for tropical formation. This is the energy to fuel the heat engine of the storm. Warmer water means more fuel. The result, if conditions are high can be more frequent and or stronger storms. For that reason, the peak of Hurricane Season is the middle of September, when tropical ocean waters are their warmest.

Subtropical Vs. Tropical Storm
For a storm to get named, it needs to have sustained wind speeds around the center at or above 39 mph. A storm can get named when it is tropical or subtropical.
Tropical Storm: Warm core and symmetrical temperatures on all sides. This is purely tropical feeding off of the warm water below.
Subtropical Storm: A mix better tropical and nontropical. It is possible this may have a colder side and warmer side. This is similar to a mid latitude storm, and what drives some of the energy. But it still feeds off of warmer water at the surface.
Post Tropical Storm: This is when a storm that was once a tropical storm or hurricane moves north. At this point it has a cold core with a warm and cold front like a mid latitude cyclone.
Hurricanes: When winds are 74 mph or higher. Then the Saffir-Simpson scale rates Categories 1 through 5
- 74 to 95 mph
- 96 to 110 mph
- 111 to 129 mph
- 130 to 156 mph
- 157 mph or higher
The maps in this slide show below break down the locations for tropical storm formation. Each map represents a 10-day period with historical plots for development. This begins on May 10th, almost a month before the typical season begins. Every eight to nine years a storm does form in May, with 18 identified on these maps. If it were to happen, the Caribbean Sea would be the ‘most likely’ spot to look.
Historical time of the formation of tropical storms by region
Data for the Atlantic starts from 1851, Pacific in 1949. Source: NOAA, National Hurricane Center
Climatology Every 10 Days—> slider


- July 9
- August 1
- August 13
- August 23
- August 31
- September 8
- September 16
- September 24
- October 4
- October 19
- November 23

Tracking With NASA
The record 2005 season had 21 named storms. The last one Zeta extending past the end of the calendar year, although it was closer to Europe.
It should be noted that there is a 30 year cycle of high and low activity in the Atlantic, and the years that followed decreased. The 2013 season was the least active matching 1982 with only two hurricanes. It was the first since 1994 with no major hurricanes (Category 3 or higher).
Video of 2005 Atlantic Season

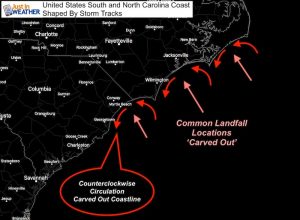
Atmospheric Memory Shaped The US East Coast
Atmospheric Memory Of Hurricanes Over Thousands Of Years Shaped The Coast
Email Updates
Please make sure you sign up (above or click here to sign up for email alerts…. ) for my newsletter. This way you will get an email to make sure you are notified of each post.
Please share your thoughts, best weather pics/video, or just keep in touch via social media
-
Facebook: Justin Berk, Meteorologist
-
Twitter: @JustinWeather
-
Instagram: justinweather
Maryland Trek 7
This will go on this August! Let’s hope social distancing will be a memory then. One way to celebrate would be to become part of my team:
- Consider joining our team for the week, a single day, or even as a sponsor.

Was Your County Not Included?
Click this map for more on the regional forecast zones


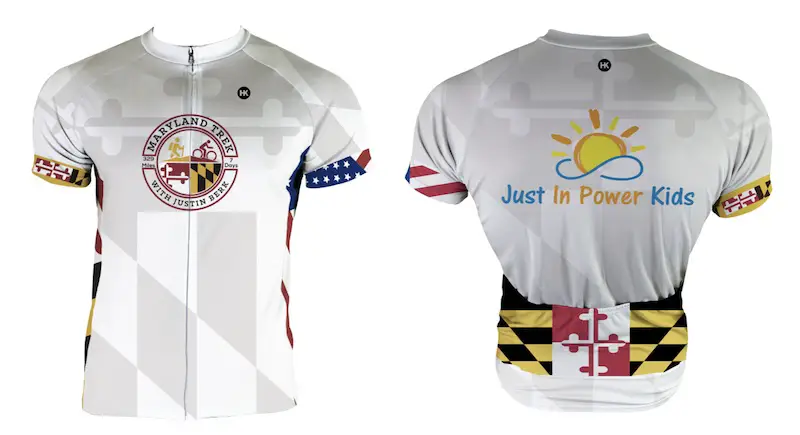
Maryland Trek Cycle Jerseys From Hill Killer
All proceeds will go to the Maryland Trek 6 total and Just In Power Kids programs
Thank you to our Title Sponsor for Maryland Trek 6
Shining on with Smyth and their contribution, our team has raised over $95,000 for Just In Power Kids to provide free programs for kids in and post cancer treatment.

Just In Power Kids:
Proceeds go to our programs Providing FREE holistic care for kids in cancer treatment and up to 5 years post treatment and caregivers.
![]()
Shine On
Proceeds from all sales go to Just In Power Kids. Click the image to shop and show your support.
