 Sunday September 17
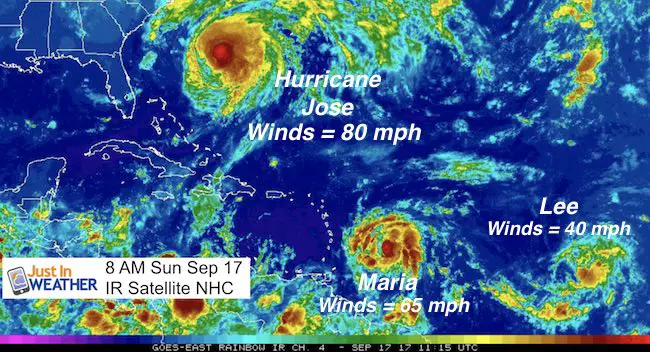
We are definitely in a pattern for the tropics. In fact a few patterns. Hurricane Jose is moving off of the coast and bringing strong waves to Ocean City. It will pass close to New England and may do a second loop. That has some models keeping it close to another hit on the US. I’ll get back to that in a moment and show two model forecast animations below. But there are two more storms that have formed the track between the Cape Verde Islands off Africa and towards the Caribbean. Lee and Maria. Atmospheric memory is trying to show itself as Maria, the newer and closer of the two, is ramping up quickly and will become a hurricane as it aims for the same islands that were hit by Irma and also impacted but Jose. The future of that storm is still more than a week away from impact on the US, but it is showing signs of trying to be a problem for our shoreline.
Let’s break these down individually
Jose
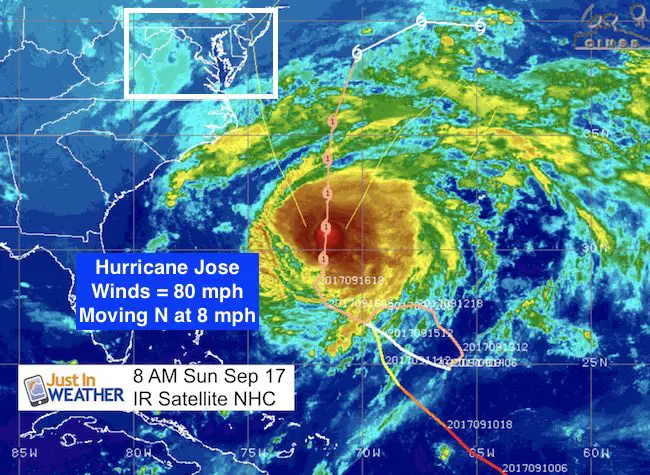
LOCATION…30.0N 71.7W
ABOUT 420 MI…680 KM SSE OF CAPE HATTERAS NORTH CAROLINA
ABOUT 435 MI…705 KM WSW OF BERMUDA
MAXIMUM SUSTAINED WINDS…80 MPH…130 KM/H
PRESENT MOVEMENT…N OR 360 DEGREES AT 8 MPH…13 KM/H
MINIMUM CENTRAL PRESSURE…973 MB…28.74 INCHES
Ocean City Impact
Rip Currents
Some Showers
Tropical Storm Force Winds: May reach by Monday night to Tuesday morning. There is a 20% chance winds reach over 40 mph (sustained). But there may be gusts that high. Most likely 30 mph winds build and continue for a two days

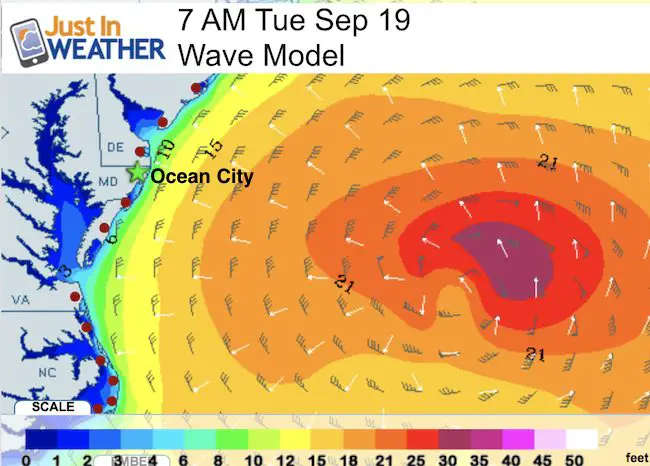
Wave Model
The strongest waves will be with the closest pass of the eye on Tuesday morning
Before Showing The Forecast Animation….
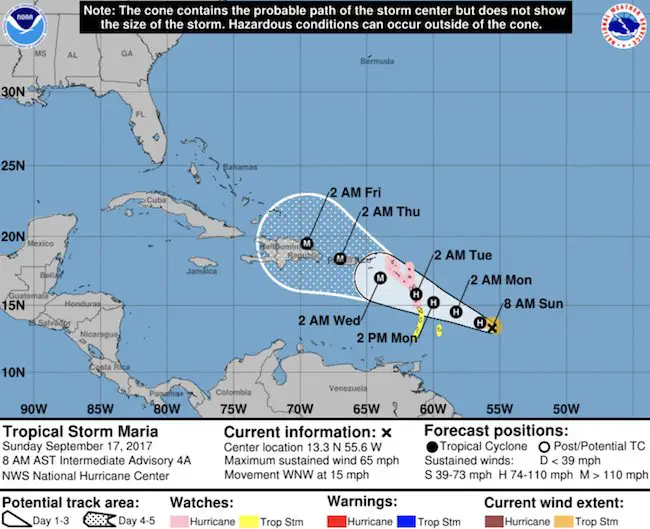
I need to describe Maria
LOCATION…13.3N 55.6W
ABOUT 410 MI…655 KM ESE OF THE LESSER ANTILLES
MAXIMUM SUSTAINED WINDS…65 MPH…100 KM/H
PRESENT MOVEMENT…WNW OR 290 DEGREES AT 15 MPH…24 KM/H
MINIMUM CENTRAL PRESSURE…994 MB…29.36 INCHES
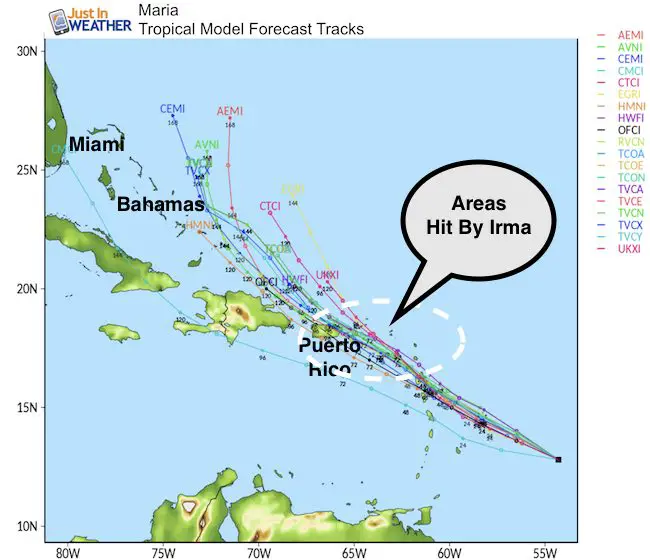
Intensity
The track of Maria looks very close to where Irma hit and the intensity forecast has this reaching over 115 mph- Category 3- Major Hurricane before hiring the islands

National Hurricane Center Plot
Note the ‘cone’. The center line is most likely ‘at this time’ and not the actual forecast. The cone is where is may actually end up. This is important when we look at the forecast plots towards the US.
What Next?
The animations I am showing here are both interesting in their own right. The European Model has proven itself to be the most accurate and reliable once again… Most recently with Irma. This has been trying to push Jose onshore in the Mid Atlantic, and even with the pass this week, it once again loops it back our way. Then ECMWF shows Maria driving into North Carolina.
The GFS Model has a mush different set up. It shows Jose moving away from New England and then Maria moving up the coast and staying offshore like Jose. Compare the two animations below…
Please note that this is a 10 day forecast! Many models has Irma up the east coast 10 days prior to landfall. I DO NOT like to lock in on a forecast that far away. But, we need to see is this steers to one side of the current forecast cone to know if this is one target or likely to change. So it is important to monitor for trends and adjustments.
Also- I still think this gives us insight into general model bias that could help anticipate trends and errors with winter storms to come
Jose and Maria Forecast Animations
European ECMWF
Jose is shown at the top of the screen. It loops and appears to move in net weekend but weaker… Maria starts on the bottom right….
American GFS
Jose is shown at the top of the screen.. trying to loop back but getting a final shove thanks to Maria. Two tropical systems can influence each other. If they are similar in intensity and size, the will orbit or swing around each other from a distance in a process called Fujiwara.
Reminder:
I am aware this may be confusing with two completely different solutions. I am not a fan of promising a storm track more than 3 to 5 days away. But we need to continue to monitor any trends as so many variables come in to play. What we can do it check on the timing and track to note intensity and impact on the islands along the way.
Also see:
Farmers Almanacs Winter 2018 Outlook- But there are more
Please share your thoughts, best weather pics/video, or just keep in touch via social media
-
Facebook: Justin Berk, Meteorologist
-
Twitter: @JustinWeather
-
Instagram: justinweather
Keep on Trekking
Continue to be part of our Maryland Trek and Support Cool Kids Campaign. This was our best event yet and we want the message to carry throughout the year.
Proceeds go to programs that help children and their families ensuring cancer treatment.
 Get the award winning Kid Weather App I made with my oldest son and support our love for science, weather, and technology. Our 3 year anniversary of the release and our contribution to STEM education is this November. It has been downloaded in 60 countries, and works in both temperature scales. With your support we can expand on the fun introduction to science and real weather.