October 22 2020
The solar cycle measuring sunspot activity has long been thought to play a role in the winter weather. Last year I showed the correlation of low sunspots and high snow in our region. But as we all know now, that was wrong! Or was it? I mean, yes our winter was a bust for snow. But that low sunspot factor could actually play more of a role this winter. I took a deeper look into it and want to show you what I found.
The winter ahead has a wide range of outlooks for snow. This is part of my Winter Outlook series where I show you many of the factors I include in my formal seasonal forecast. There are conflicting signals for more AND less snow this winter that I have been showing you. It’s importing to keep in mind which factor could have more impact than others.
Here is the case for low sun spots correlating to more snow one year after the solar minimum, where we are now.
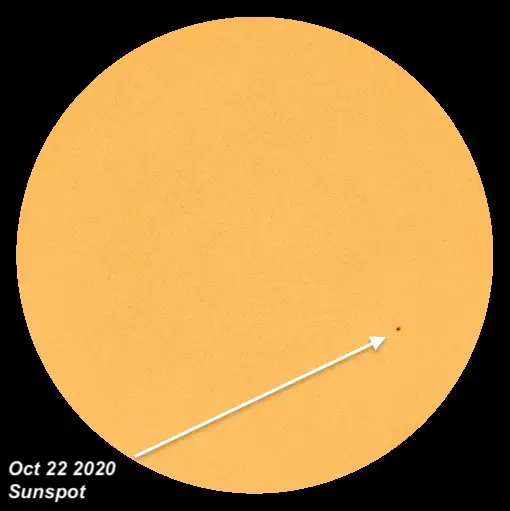
Sunspot Activity: NASA Solar Dynamic Observatory
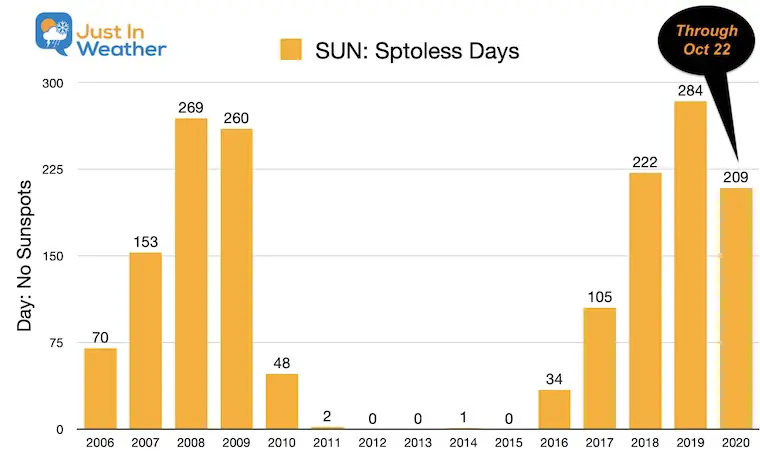
There is one sunspot observed as I wrote this post. We have had 209 days so far this year with no observed sunspots. That is 71% of the year to date. That is less than last year to date, but still in the minimum as we have begun a new solar cycle.
Solar Cycle Tracking Is Important
NOTE: This is the core of the information I shared last year. Please review. I am about to show you why I think it did‘t work last year, but may apply this year.
Solar Activity has been traced and documented for hundreds of years. It’s believed that loner periods of low activity like we are entering now could related to global cooling.
Between 1645 and 1715 and extended period of Low Sunspot Activity was called the Maunder Minimum. This period correlated to cooling on a global scale and was known as the Little Ice Age. The timing and impact in Europe and around the globe has been up for debate.
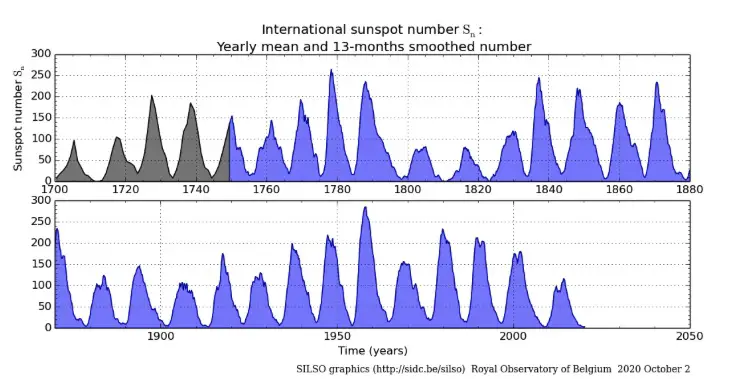
Half A Century Of Solar Cycles
Tracking the space weather, the Sun’s activity, and the solar cycle has a wide range of implication. This ranges from space travel, satellite communications, and even weather here on Earth.
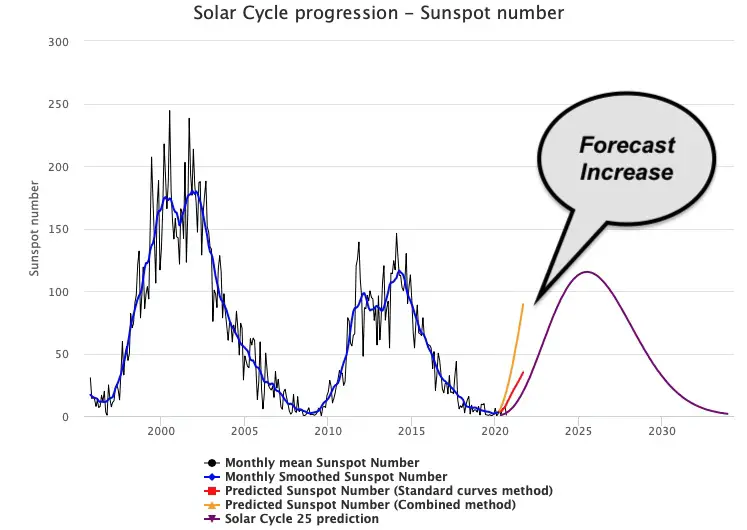
This chart of sunspots showing the past 6 solar cycles. The years at the bottom indicate each solar minimum.
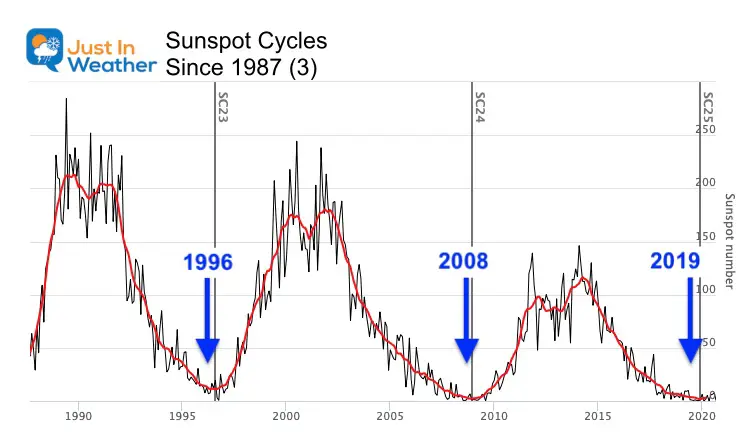
Closer Look At The Past 3 Cycles
The mistake I made last year was that the last solar minimum was in 2008, not 2009. It was the year before our record winter! This new Solar Cycle 25 began last year in December. If we extrapolate out, this winter will be one year into the new cycle, while still at near minimum. This correlates to the winter of 2009-2010, one year into Solar Cycle 24.
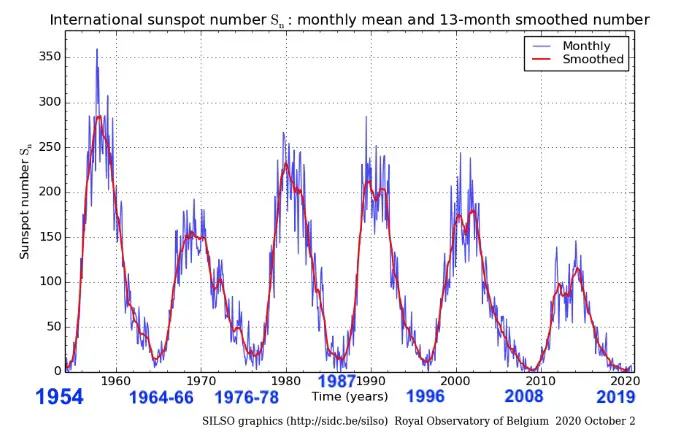
Recent Solar Cycle
Officially the new Sun Spot Cycle 25 began in December 2019. We are in the period now with the forecast increase in solar storms, but still near the minimum.
Spotless Days In Recent Years
More spotless days (taller bars in the graph) means less solar activity. The last peak was in 2008 and 2009. We are now coming off the most recent peak. Note, this chart was made on October 22, 2020. There will be more to add to this bar on the chart.
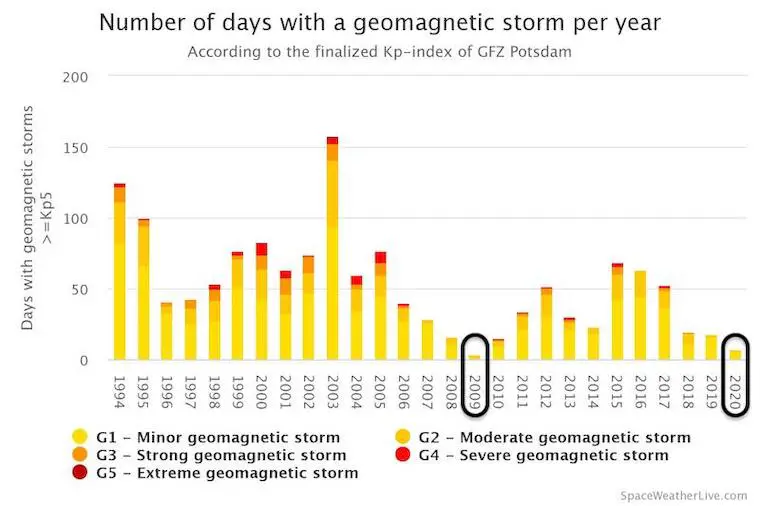
Geomagnetic Storms (Solar Flares)
Another measurement of the sun’s activity are the solar flares sent into space.
This chart shows those storm days bottomed out 1 year into the new solar cycle! As shown above, the last Solar Cycle 24 began in 2008. There were a little less spotless days in 2009, but below we see the geomagnetic storms were lower that year. That was also the start of that really snowy winter in the eastern US.
- 1996: Not highlighted in the chart, also was the lowest geomagnetic storm number and high winter snowfall.
- 2020 (so far), we are on pace to have less spotless days, but also less geomagnetic storm activity than last year.
There are 6 more weeks of data still to add to this chart.
Correlation To Winter Snow
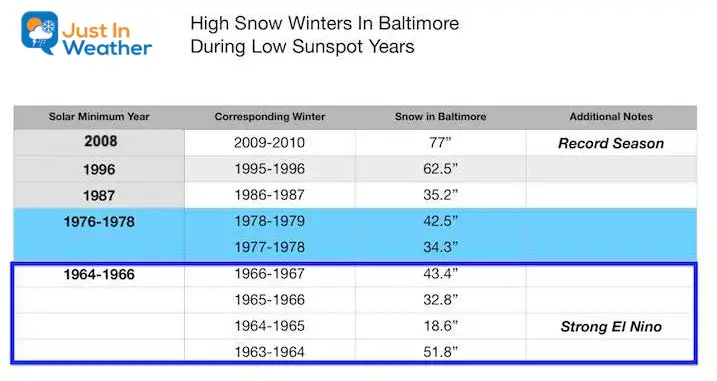
Solar Minimum And Snowy Winters For Our Region
Looking back at the last 5 solar minimums with respect to the winters, and there is strong correlation to high snowfalls. The last solar minimum was in 2008, which also happened to be when we had our record winter 2009-2010 of 77 inches of snow in Baltimore.
In fact, just about every solar minimum related to a very snowy winter within a year prior or afterwards.
- Almost all of these winters had OVER 30 inches of snow.
- Five winters had over 40 inches of snow!
- The slightly below average snow winter was in 1964-1965 when a strong El Nino was present to add more amplification to the global weather patterns.
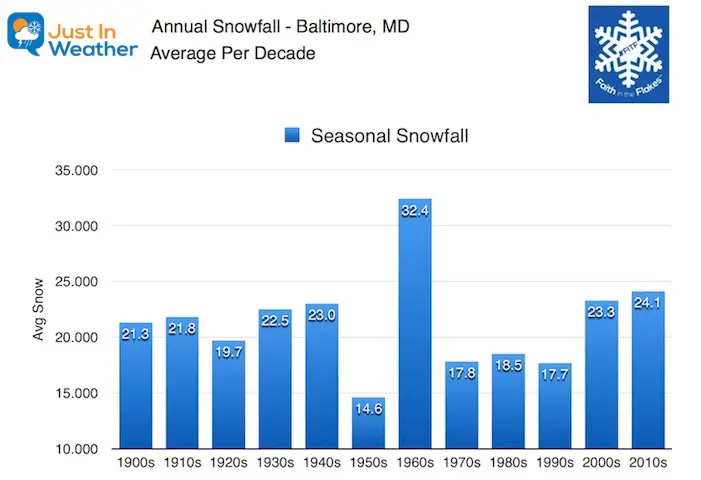
Compare to Average Baltimore Snow
- 20.1″ = The current average is based on 1981 to 2010 (We are waiting for the official updated number including last decade).
- 21.7” = The long term average since 1883.
Why does this mean this year?
Correlation is NOT causation. That is the main rule in science and one any good scientists should have been thinking while reading my report.
I believe the thinking last year of our solar minimum once again resulting in more snow was flawed, because we missed one element: Geomagnetic Storms! If that is the key factor, for whatever reason, then we have that on our side this winter. That is why I think the solar minimum will play a bigger role this year after the bust from last winter.
Once again, I know you have seen mixed signals from my reports. No one element is the only reason for the storm pattern next season. I will weigh them all.
My formal winter outlook should be ready by the first week of November. There are some other factors I am still working on such as tropical tracks and building snow pack in Siberia and northern Canada.
It Does Not Snow Less
That is a common misnomer. I’ve compiled these statistics for Baltimore annual snow, and plotted by decade. We do have wide fluctuations from one year to the next, but the trend has been averaging UP in the last 20 years.
Winter Outlook Series
FITF and SnowStix Stores are now OPEN
FITF GEAR
- Thanks to my wife Shannon who wanted to bring these hats to life.
- The Maryland Hoodie is high quality and a new way to show off our love of Snow and State.
- New items will be added soon.


New Colors Available

Please share your thoughts, best weather pics/video, or just keep in touch via social media
-
Facebook: Justin Berk, Meteorologist
-
Twitter: @JustinWeather
-
Instagram: justinweather
Email Updates
Please make sure you sign up (above or click here to sign up for email alerts…. ) for my newsletter. This way you will get an email to make sure you are notified of each post.
Also See:
Explore More:
Autumnal Facts and Weather Stats

Record Low Tied at BWI and Frost Photos Sep 20

Typical First Frost and Freeze
