October 7 2020
The ocean water temperature in the Pacific Ocean is one of the prime elements that plays a big role in our winter storm patterns. This year we have a La Nina pattern with cooler water to add to the formula. NOAA has issued a La Nina Advisory for the upcoming winter, which has a solid impact on our weather in the Mid Atlantic US.
Below we will take a look at the prior La Nina Winters in Baltimore since 1950.
La Nina 2020 Formation Seen On Satellite
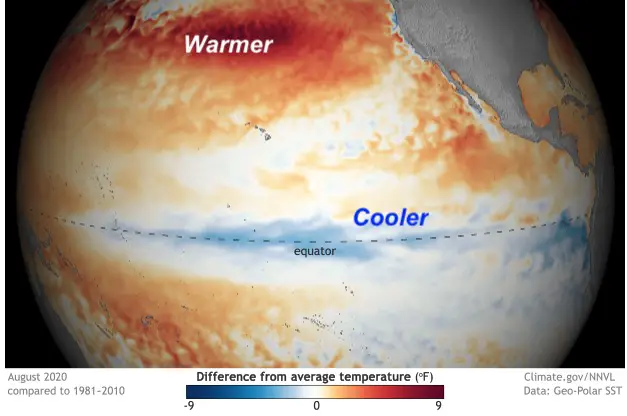
The image above was a measurement of cool water dominating the equatorial water in the Pacific Ocean. The popular El Nino is when warm water in the tropical Pacific moves east and shifts the jet stream over North America. This happens every 3 to 7 years. The rest of that water gyre is called the Southern Oscillation. La Nina is when cool water upwelling resumes in the eastern Pacific, and the warmer water is pushed farther west.
The above image was from this past August. The animations below show the development between July 15 and September 30, 2020
Sea Surface Temperature Animation
This is the view of the Pacific Ocean. On the right side is Central and South America. On the lower left is Australia. The middle is the equator.
Sea Surface Temperature Anomalies Animation
Here is the anomaly. This is a better display of the ‘cooler than normal’ water expansion seen in blue.
Video: La Nina Explained
From NOAA’s National Ocean Service
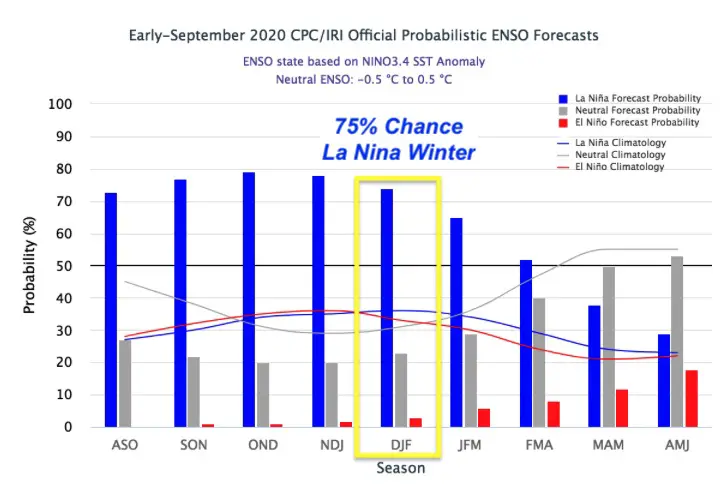
NOAA La Nina Forecast
The period of winter is defined as December – January – February.
This has a 75% chance of a La Nina this coming season.
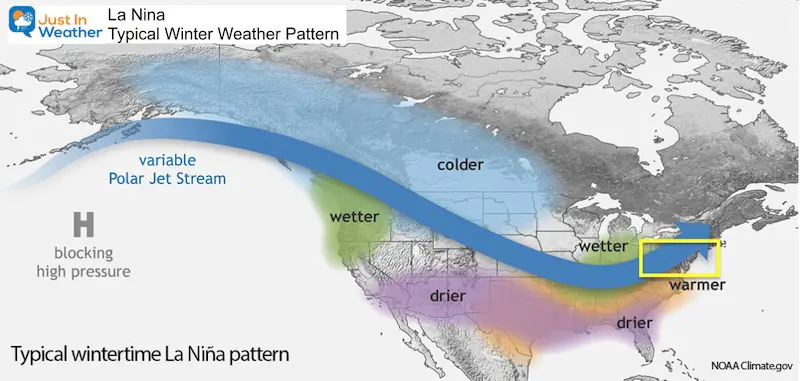
La Nina Winter Weather Pattern
The storm track from the Pacific Ocean tends to take a northern route, diving across the central plains, then up the Ohio Valley.
I want to emphasize that this is the NOAA map for a ‘typical La Nina’ storm pattern. It is not static for the entire season.
I put the yellow box over the Mid Atlantic. We are in a region that can be on the edge of the storm track. There are other factors that can shift this south and colder for us, or west and warmer. It is possible to average a warm pattern, and still get a few strong cold storms.
La Nina Winter History: Baltimore
These state generated from the National Weather Service are not supportive of a snowy winter. The caveat is that this is only from 1950 to 2017. There are quality weather records back to 1882. But the La Nina years historically are more extrapolation, since that pattern was not thoroughly studied by scientists then.
However, within this data there are exceptions and other factors that may not have teamed up together before. I will continue to explore them for my formal outlook.
Important To Note:
La Ninas are not all the same. The intensity ‘weak’, ‘moderate’, and ‘strong’ can yield different results for our region.
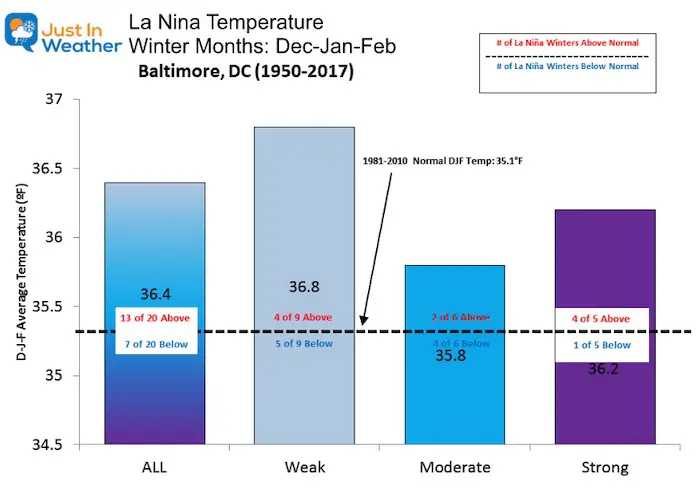
Temperatures
Warmer than normal 65% of the La Nina Winters.
Cooler than normal 35% of La Nina Winters.
- Weak La Nina is even chances.
- Moderate La Nina is most likely to bring colder temperatures.
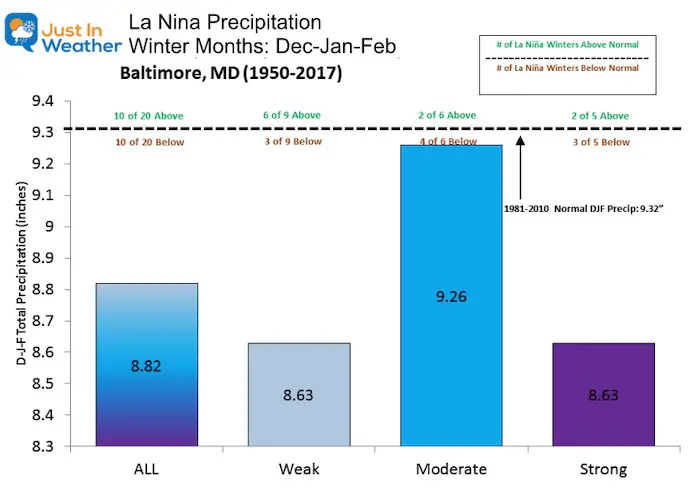
Precipitation
This is total precipitation for rain and snow.
Overall there is an even split. But this chart can be confusing. A Moderate La Nina has had 4 of 6 times been below average, but the chart has the largest total. This is because when there is an above average pattern, it can be WAY ABOVE AVERAGE to offset the total comparison.
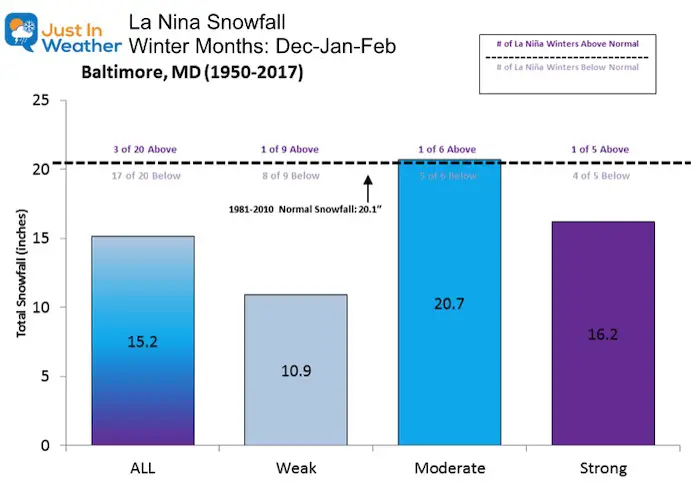
Snowfall
If you have Faith in the Flakes, this might not be what you want to see. But there is a silver lining. While most years show below normal snow, there have been some big exceptions.
- 1996- January Blizzard was in a La Nina year. This also accounted for most of the snow that winter.
- 2000 – Most of snowfall that winter was in a 10 day period between January 20 and 30. This included the ‘surprise’ Nor’easter that brought 14.9″ of snow to BWI on January 25.
Take Away:
If you don’t want snow, La Nina historically has been your friend.
But if you have FITF, all is not lost. There have been years with big snow storms during a La Nina. Also, there are other elements at play. That is what I explore and try to fit together. This is not scientific law, only one theory. Correlation is NOT causation! It is possible that this winter may have a new combination of global influence to bring us something unprecedented. Besides, these numbers above are only a sample of 77 years. There may have been more supportive data in prior years.
Winter Outlook Series
FITF GEAR
- Thanks to my wife Shannon who wanted to bring these hats to life.
- The Maryland Hoodie is high quality and a new way to show off our love of Snow and State.
- New items will be added soon.


New Colors Available

Also See:
Sunflower Season: Millers Farm Photos And Info

Help Solve The Mystery
UFO, Meteor, Or Something Else Caught On Cam In Owings Mills MD This Week?

Explore More:
Autumnal Facts and Weather Stats

Record Low Tied at BWI and Frost Photos Sep 20

July 2020 The hottest on record. Will it hint at snow this winter?

Typical First Frost and Freeze

Please share your thoughts, best weather pics/video, or just keep in touch via social media
-
Facebook: Justin Berk, Meteorologist
-
Twitter: @JustinWeather
-
Instagram: justinweather
Email Updates
Please make sure you sign up (above or click here to sign up for email alerts…. ) for my newsletter. This way you will get an email to make sure you are notified of each post.
14 Local Maryland Pages (and York PA)
We have made a page for Maryland Weather which gives you the current conditions for 14 present area locations. Many of these match up with the spots on our route. Please use this list below are reference. I will include them daily with my articles on the kids.
Maryland Weather Page
I wanted to keep it simple. Just the basics for a quick view at any time.

Maryland Trek Team Shirt
All proceeds will go to the Just In Power Kids programs

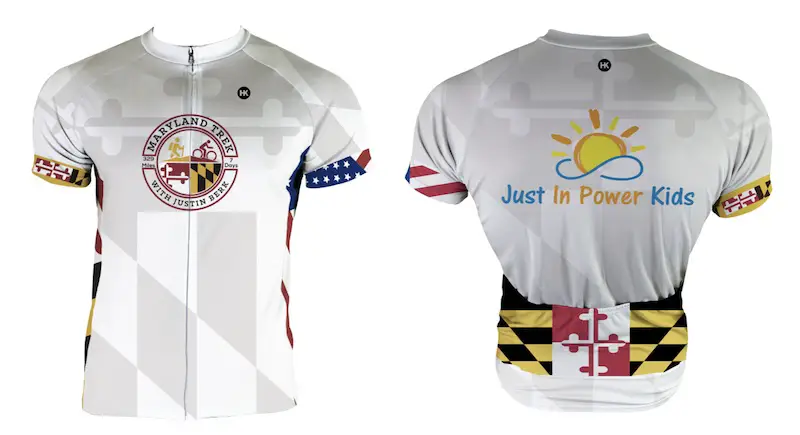
Maryland Trek Cycle Jerseys From Hill Killer
All proceeds will go to the Just In Power Kids programs
Also See:
Maryland Strong Love ❤️
My ‘bonus’ daughter made this map of Maryland a few years ago. We brought it back for needed positivity. Now on her pick of tanks, and this cool Maryland T for men or women.
Click here or on the image to see more
This is all LOCAL: Made by Maryland Print House; Proceeds support my Maryland Trek 7 this August for Just In Power Kids.
Related Posts
2020 Tropical Storm and Hurricane Names and Naming History

Atlantic Tropical History: Maps of Origin Regions Every 10 Days


Other Links:
Was Your County Not Included?
Click this map for more on the regional forecast zones

Baltimore Weather At BWI May Not Be As Hot As Reported
Construction at the airport close to the weather station may be added artificial heat. Click here or the image for the details.


Just In Power Kids:
Proceeds go to our programs Providing FREE holistic care for kids in cancer treatment and up to 5 years post treatment and caregivers.
![]()
Shine On
Proceeds from all sales go to Just In Power Kids. Click the image to shop and show your support.
