November 4, 2019
I believe we have a good chance for a snowy winter with at least one big storm! There, I said it. If you have been following my forecasts for years on TV or online, then you know I love snow. I am careful to not let my bias influence my outlooks, or we all could be left disappointed. But there is math to support it this year. Do you have Faith in the Flakes? This info might help get you in the mood. Also, see some new FITF gear I am debuting below. Thank Shannon (weather wife) for her influence on this.
Average Snow In Baltimore Is Increasing And This Year Should Add To It
This year there is a growing list of elements that support more snow in our region this winter. Before I publish my formal winter outlook for Winter 2019 to 2020 in the Mid Atlantic, I want to break down the information in separate reports so it all won’t be overwhelming.
The purpose of this post is only to show snow history some patterns I have identified.
Let’s start with the snow statistics using Baltimore as the center point for our region.
Snow Monthly Average And Records
Historically snow can fall between October and April. Realistically, getting stickage (snow to lay and stay on the ground) and accumulation begins in November and lasts into March.
- Real snow season is December through March.
- Snowiest month= February when Baltimore averages 8″ . But, we have had as much as 50″ when two blizzards hit in 2010!
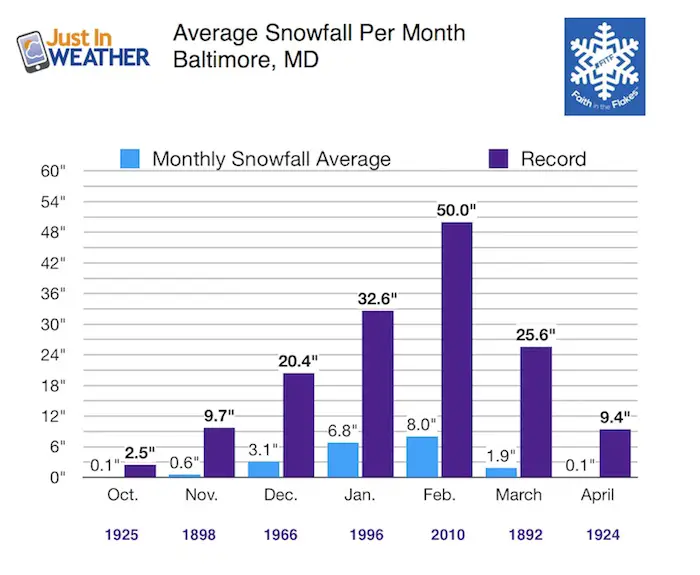
Measurable Snow
- Earliest: October 10, 1979 0.3”
- Latest: April 28, 1898 0.1”
Long Term Trends
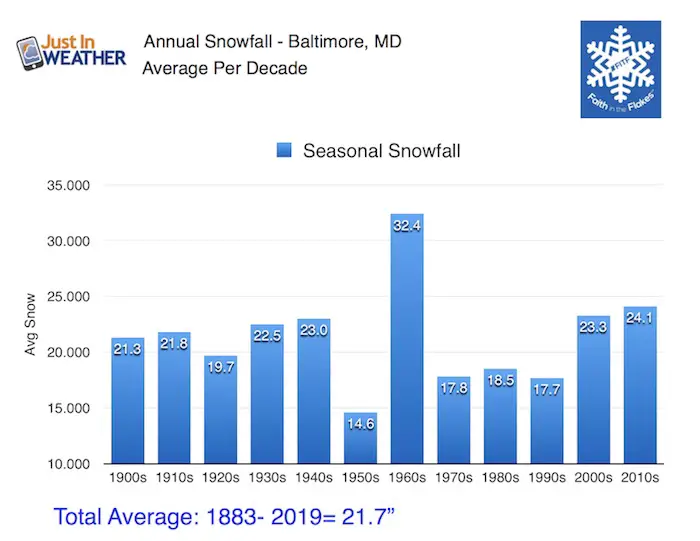
I have studied every year of snow records in Baltimore since 1883. There have been multiple locations and techniques, so I cringe with the accuracy long ago. But this is all we have to work with, and I charted the average snowfall each decade since 1900 to show the fluctuation.
The most extreme snow average per decade proves how abruptly a snow pattern can change and lock in for years:
1950s = 14.6″/year –> The Lowest Snow Decade
1960s = 32.4″/year –> The Highest Snow Decade
Trending Up
The 1970s- 1990s averaged below 19 inches of snow. However the past 20 years has averaged over 23 inches of snow. Even with some low snow winters recently, the long term average has been higher. This year should trend up.
Average Snow Changes
The National Weather Service bases average snowfall on a 30 year period. Like the census, every decade that gets updated.
20.1″ = The current average is based on 1981 to 2010 (We will get an updated number next year)
21.7” = The long term average since 1883
24.1” = The average for the past decade (see the chart below)
NEW FITF GEAR THIS YEAR
Thanks to Shannon (weather wife) who wanted to bring these hats to life. *Mustard is her favorite color
The Maryland Hoodie is high quality and a new way to show off our love of Snow and State.
The T-shirt… Something you may find familiar. Why just a T? Because many schools I visit have the heat on high for faculty and staff. But you can put a long sleeve underneath for cool look. I will have wifey model these soon 🙂

Average Snow This Past Decade
After the epic record 2009-2010 winter dumping 77 inches (arguably higher but NWS lowered the blizzard totals), we had three below average winters. Then three good winters between 2013 and 2016. That last year was mostly in our record January storm! Then we were back below average for three years. If you were counting cards, you would think the deck is stacked and due to deliver another high number (or face card) for us.
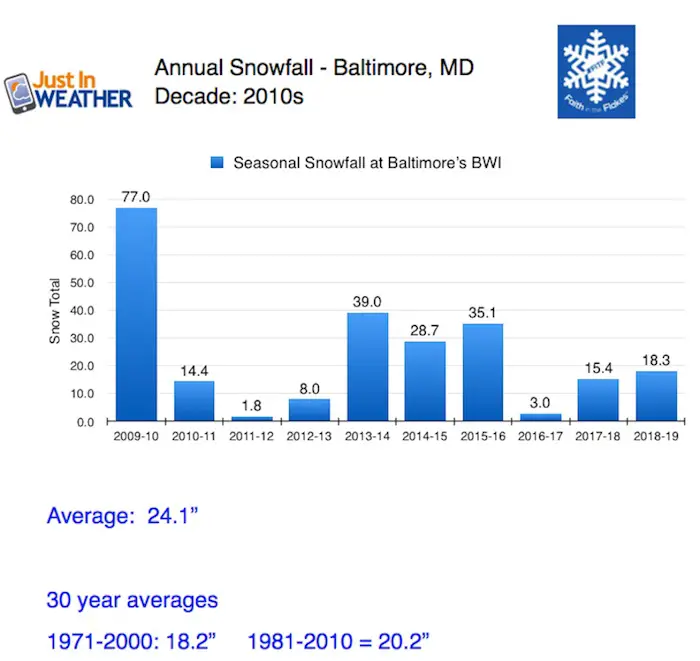
I included the adjusted 30 year averages below. Depending on how this winter ends up, it is likely this higher snow decade will bump the 30 year average for our region as this past decade has shown 24.1″/year.
Storm Patterns: Are We Due For A Big Snowstorm?
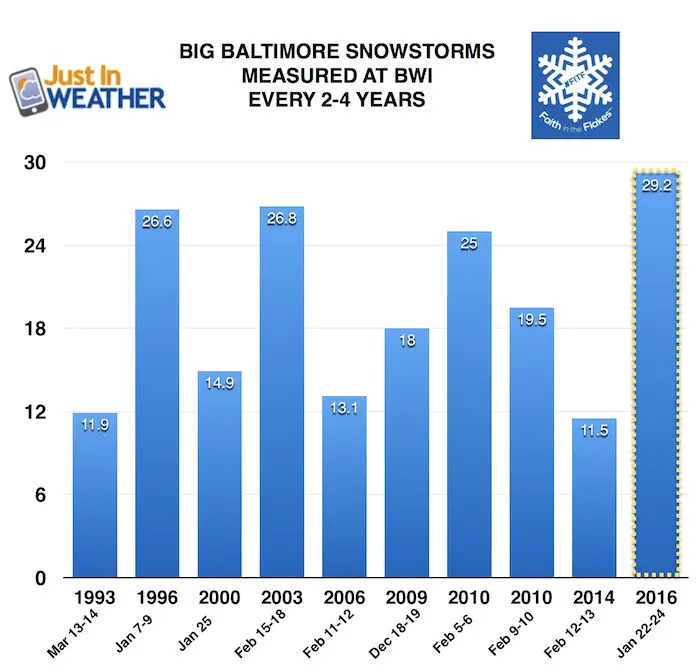
The largest snowfall on record in Baltimore was nearly 4 years ago. Based on the pattern shown here we are due!
It was January 2016 when over 29 inches fell in a single event. Before that storm, it was two years in 2014. Before that it was another 4 years when we had our record 2009-2010 winter with 3 blizzards (that was truly special). The Presidents Week Storms before that were separated by 3 years in 2006, and 2003. I can go on, and on…
The chart below shows the big snow events in Baltimore every 3 to 4 years over the past three decades. The pattern does average out much farther back into the 70s. In fact NWS has identified it over the entire span of records. See below.
Yes!
If you subscribe to this weather pattern like I do, then this will be our year for at least one big storm in Baltimore of around a foot or more of snow. This winter puts us in the four year span since we got hit.
There is more information to support my suggestion. Please check back all week for my reports leading up to my Winter Outlook for 2019-2020.
Snowstorm Time Pattern
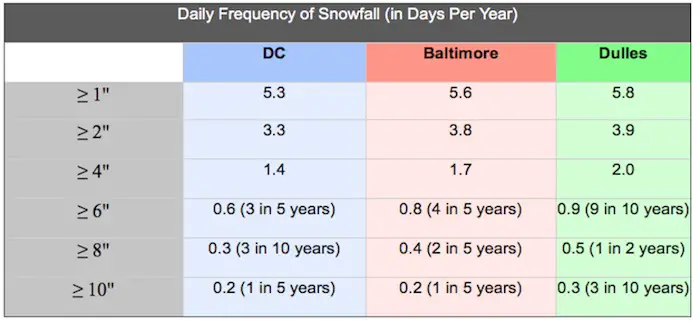
This chart is from The National Weather Service in Sterling, VA. Here is what it means:
Baltimore averages an event with:
- Over 2 inches of snow nearly 4 days per year.
- Over 4 inches of snow nearly 2 days per year.
- Over 6 inches of snow 4 out of 5 years or 80% of winters
- Over 8 inches of snow 2 out of 5 years or 40% of winters.
- Over 10 inches of snow 1 in 5 years, or 20% of winters.
Top 25 Snowstorms in Baltimore
The events with the * were subjected to the NWS retroactively lowering the totals based in a conflict of measuring using FAA standards Vs. NOAA standards at BWI Airport. Do you want to ad to this list this year? We shall see…

Other Winter Outlook Posts
Snowy Winters Following A Hot and Dry September

Get Forecasts By Email
Just in case you don’t get all posts on your social media feed, stay up to date with the latest info…
Click here to sign up for email alerts…. Be the first to hear any new weather
Thank you to our Title Sponsor for Maryland Trek 6
Shining on with Smyth and their contribution, our team has raised over $95,000 for Just In Power Kids to provide free programs for kids in and post cancer treatment.

Please share your thoughts, best weather pics/video, or just keep in touch via social media
-
Facebook: Justin Berk, Meteorologist
-
Twitter: @JustinWeather
-
Instagram: justinweather
ALL FITF Apparel Available


New Colors
We are giving 10% of each sale to Just In Power Kids: Providing FREE holistic care to pediatric oncology patients and FREE healthy meals to local hospitals.

Also See:
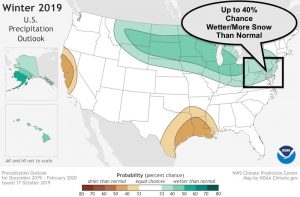
NOAA Winter Outlook Leaves Room For More Snow With Mild ‘Seasonal Average’ Temperatures
Many areas inland from the cities should drop into the 30s by tomorrow morning. This could do it.
See the maps for when we normally expect the first frost in this link.

Baltimore Weather At BWI May Not Be As Hot As Reported
Construction at the airport close to the weather station may be added artificial heat. Click here or the image for the details.

Other Links:
Atmospheric Memory Shaped The US East Coast
Atmospheric Memory Of Hurricanes Over Thousands Of Years Shaped The Coast

Was Your County Not Included?
Click this map for more on the regional forecast zones

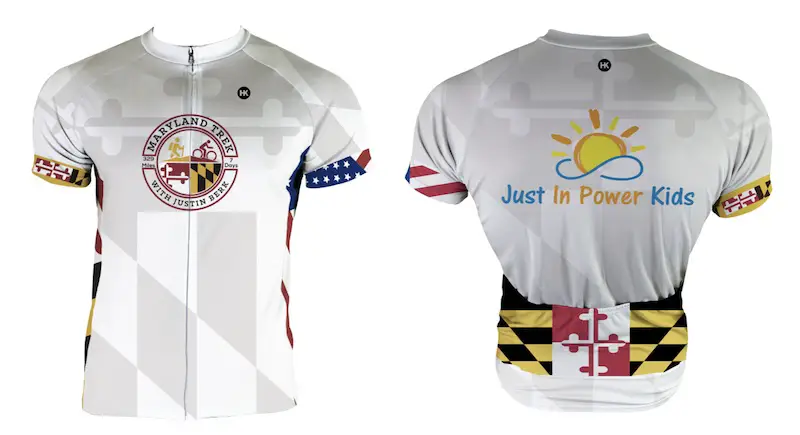
Maryland Trek Cycle Jerseys From Hill Killer
All proceeds will go to the Maryland Trek 6 total and Just In Power Kids programs
Just In Power Kids:
Proceeds go to our programs Providing FREE holistic care for kids in cancer treatment and up to 5 years post treatment and caregivers.
![]()
Shine On
Proceeds from all sales go to Just In Power Kids. Click the image to shop and show your support.
