 3 PM Monday September 18
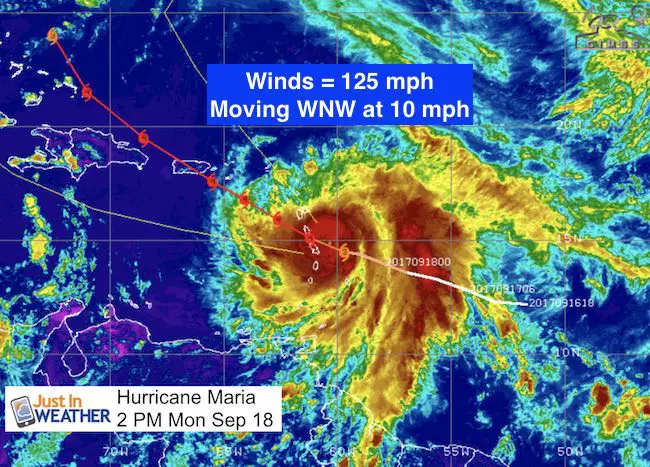
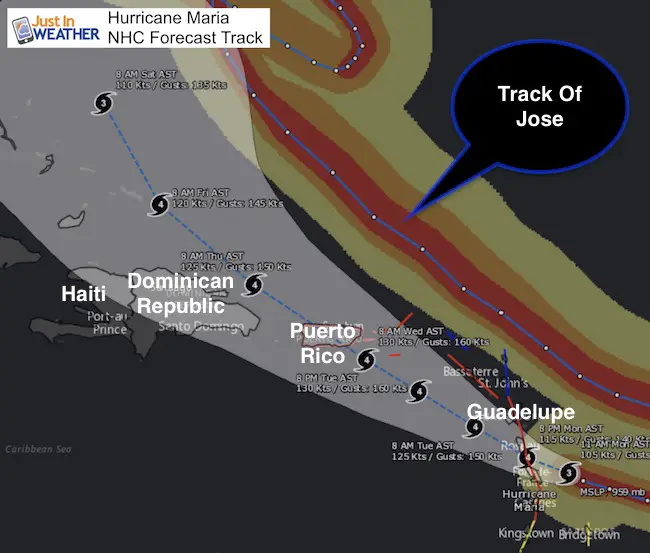
Maria is now a Category 3, Major hurricane with winds of 125 mph. It is expected to continue to strengthen over the next day or two up to a category 4. The track of this storm is just south of the path Jose and Irma displayed, but will be impacting some of the same islands, and hit the US territories head on this time. The center of the forecast cone puts the strong side of the storm over St. Croix, St. Thomas, and St. John, with the eye passing over Puerto Rico. Both of these areas got a glancing but damaging blow from Irma and a hit from Maria would be absolutely devastating.
Rainfall up to 20 inches and storms surge up to 9 feet can be expected as the storm is forecast to reach Category 4 when arriving Tuesday.
This report is to give more detail about the impact on the US islands interest in the region just to consolidate information. The impact will be widespread and my heart goes out to all of the islands across the path that will be affected.
Below are close up maps of the projected path and where the stronger side of the storm will be. Also the latest forecast animation and what it may do off the US east coast next week.
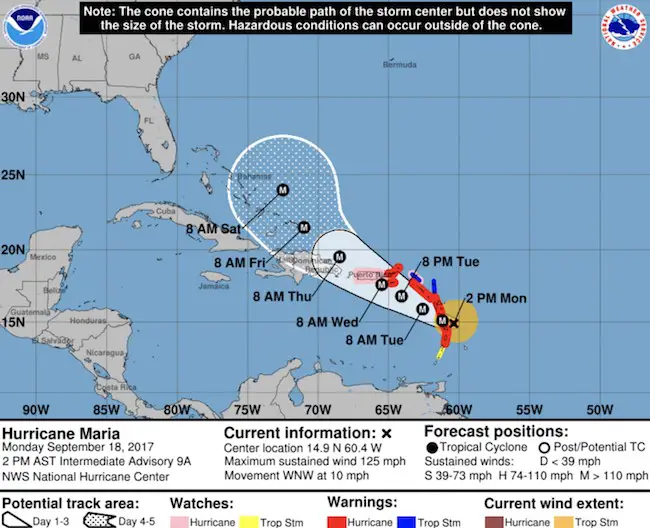
NHC Stats As of 2 PM
LOCATION…14.9N 60.4W
ABOUT 45 MI…70 KM ENE OF MARTINIQUE
ABOUT 70 MI…115 KM ESE OF DOMINICA
MAXIMUM SUSTAINED WINDS…125 MPH...200 KM/H
PRESENT MOVEMENT…WNW OR 285 DEGREES AT 10 MPH…17 KM/H
MINIMUM CENTRAL PRESSURE…956 MB…28.23 INCHES
Smaller Core Storm
- 15 Miles = Hurricane Force Wind Field
- 125 Miles = Tropical Storm Force Wind Field
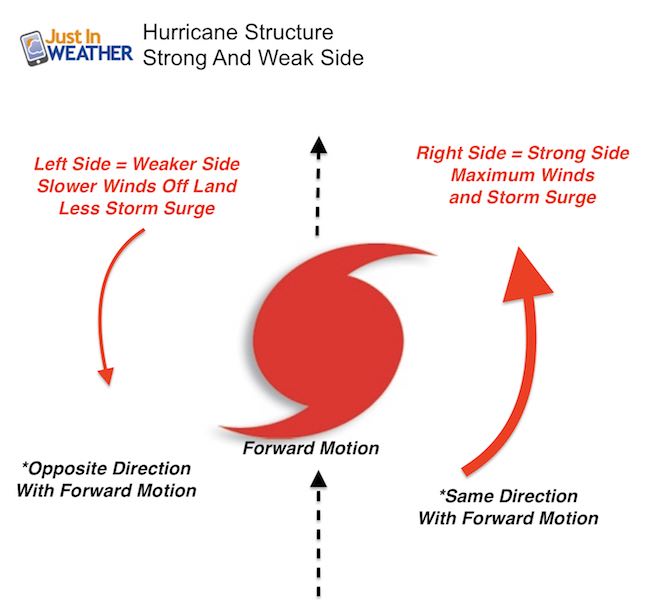
Hurricane Structure
It is important to note the stronger and weaker side of a tropical system, especially since the wind field is small with this storm. The right side has winds around the eye wall with the forward motion, maximizing the wind and storm surge. The left side has the winds flowing opposite to the forward motion and thus counteracting the affects making it the weaker side.
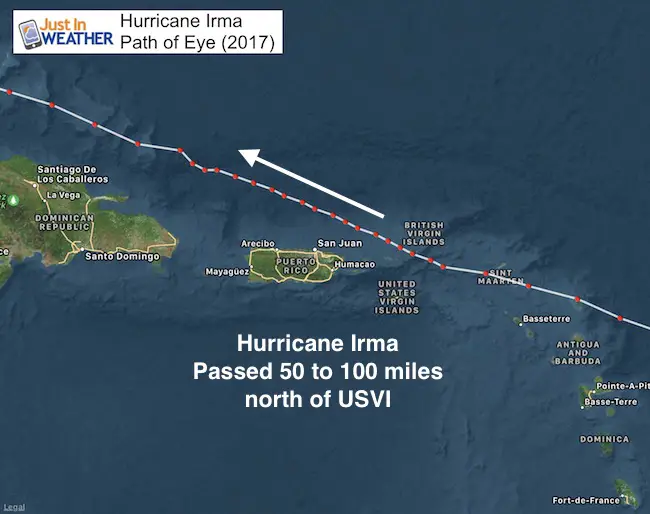
Compare to Path Of Irma
The eye of Irma passed 50 two 100 miles north of the US Virgin Islands and Puerto Rico. Irma was a much larger and stronger storm, but considered to have sent the weaker side of the storm to the islands, as bad as it was. The path of Maria seen below shows that the US Virgin Islands will be on the ‘stronger side’ of the path and Puerto Rico may take a direct hit from the eye.
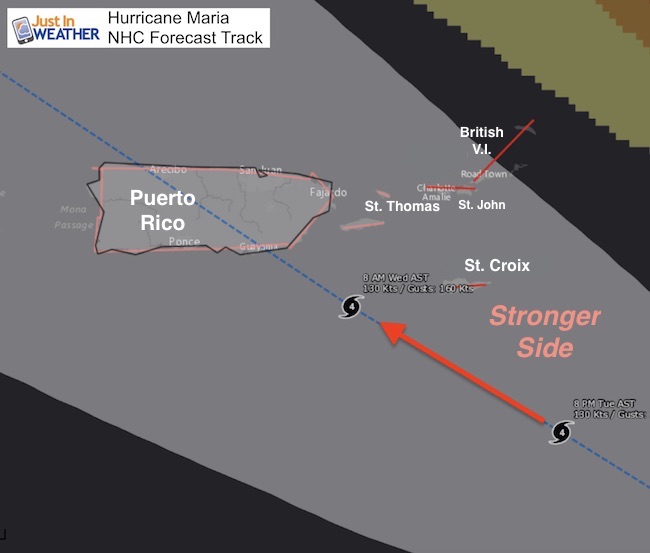
Close Up Forecast Path
The latest forecast path does put St. Thomas on the right side of the eye wall. Meanwhile the eye is forecast to cut across Puerto Rico. Some wiggle room is possible. But this will place the strongest winds and storm surge on the north or right side of the path.
Storm Surge Forecast
6 to 9 Ft expected on US Virgin Islands and Puerto Rico
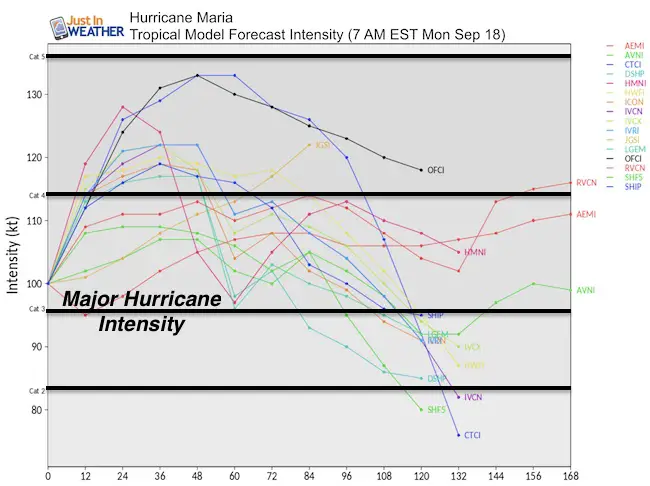
- Category 3 = 111 mph to 129 mph
- Category 4 = 130 mph to 156 mph
- Category 5 = 157 mph +
Note:
Wind Speed of 130 knots = 150 mph
Wind Gust Forecast of 160 knots = 184 mph
Arrival Time
The worst conditions for the Virgin Islands and Puerto Rico will be Tuesday Night and Wednesday.

Getting Stronger: Intensity Forecast
Watches and Warnings
- Warnings mean conditions are expected in the next 36 hours or less
- Watches are for potential conditions in the next 48 hours
- Tropical Storm Winds are 40 mph and higher. Hurricane Force Winds are 75 mph and higher.
A Hurricane Warning is in effect for…
* Guadeloupe
* Dominica
* St. Kitts, Nevis, and Montserrat
* Martinique
* St. Lucia
* U.S. Virgin Islands
* British Virgin Islands
A Tropical Storm Warning is in effect for…
* Antigua and Barbuda
* Saba and St. Eustatius
* St. Maarten
* Anguilla
A Hurricane Watch is in effect for…
* Puerto Rico, Vieques, and Culebra
* Saba and St. Eustatius
* St. Maarten
* St. Martin and St. Barthelemy
* Anguilla
A Tropical Storm Watch is in effect for…
* St. Vincent and the Grenadines
National Hurricane Center Forecast Map
Outlook For US East Coast?
I need to point out that I DO NOT support locking in a forecast track more than 5 days away. That is what the cone from NHC widens. There are too many variables such as forward speed and intensity that can dramatically change the plotting of a storm farther out in time. So this forecast for the east coast has changed from a hit as recently as yesterday’s modeling to now curving away from the coast. This will depend on how this behaves in the islands and if it weakens more or holds intensity longer.
Also See: Tropical Storm Watch in Ocean City and Northeast for Hurricane Jose
GFS Model Plot From Monday Morning
7 PM Fri Sep 22 to 7 PM Fri Sep 29
*Day 4 to Day 11 in the forecast period
GFS now shows a clip along OBX. This is father west than all overnight models that showed this turning safely out to sea. I expect more wobbling of the model projections as the short term intensity and path are subject to change.
Please share your thoughts, best weather pics/video, or just keep in touch via social media
-
Facebook: Justin Berk, Meteorologist
-
Twitter: @JustinWeather
-
Instagram: justinweather
Keep on Trekking
Continue to be part of our Maryland Trek and Support Cool Kids Campaign. This was our best event yet and we want the message to carry throughout the year.
Proceeds go to programs that help children and their families ensuring cancer treatment.

 Get the award winning Kid Weather App I made with my oldest son and support our love for science, weather, and technology. Our 3 year anniversary of the release and our contribution to STEM education is this November. It has been downloaded in 60 countries, and works in both temperature scales. With your support we can expand on the fun introduction to science and real weather.