November 19 2020
We are going to get more snow than last winter! That’s the easy part, because there isn’t much room for less than 1.8 inches in Baltimore. But while it may seem like a real winter was a distant memory, I have reason to believe a sense of normalcy will return. Eventually.
I know the world is upside down with COVID19 and distance learning. But for the kid in me, my family, and countless other kids I believe snow and snow days are still important.
I see this winter likely to get off to a slow start, but then bring bursts of storms and a stronger finish. I know many other forecaster outlooks have been mild and low with snow. Many of them are heavily weighted in La Nina. That is ‘not’ the only factor in our patterns, and may not dominate all season.
My winter outlook I present to you here is the culmination of a few months of research and many articles I have already published. If you missed them, they are all referenced throughout, with a full list at the bottom of the report.
I will briefly show the case for each element I include, then give my snow numbers for Baltimore and a snow map for our region.
Below I also will show you one analog year (similar pattern). It overall was mild, but had a burst of storms that resulted in above average snowfall for the season.
Winter Scene I am waiting to see again
I look for La Nina AND a stronger Polar Vortex to start winter more mild. Then BOTH of these elements should weaken, unleashing more cold and snow on the back half.
Grading My Past Outlooks
Before looking at why I am a little more bullish on snow, I wanted to remind you how I have done with past few winters.
If you are new to my work, this site, or don’t know me well, please consider this:
- I love snow, but I do not wish-cast and am opposed to click bait!. I publish what I believe and hold myself accountable.
- If I am wrong, why would you trust me and come back?
- I always ask you to publicly grade my snow forecasts when good or bad.
- Faith in the Flakes is a motto my son and I came up with over 10 years ago. #FITF is my brand, but I do not let that get in the way of science or this outlook.
My Report Card: Last 7 Years
I have kept solid track of my online winter seasonal outlooks since 2014
My two best winters I predicted under the total. I did over estimate winter snow for the past 4 years. Out of them, I had two Fs!
As a dad, professor, and student of weather I aim to learn from each one.
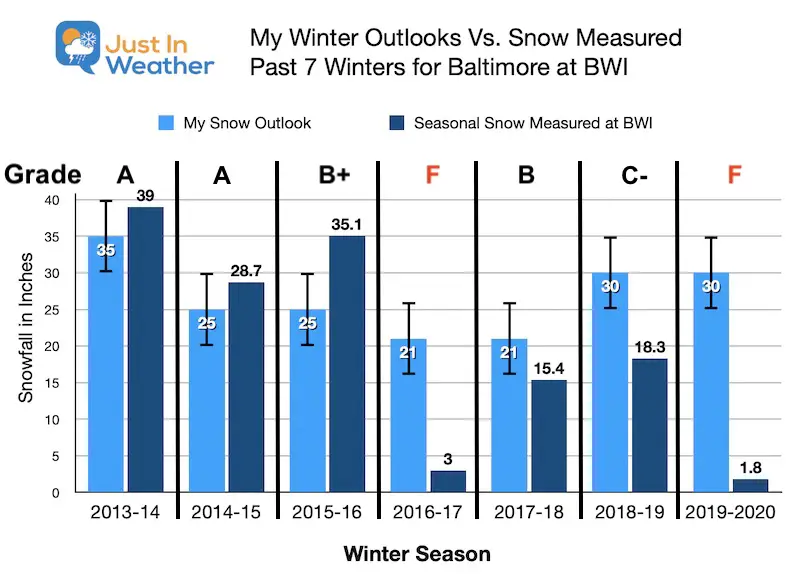
Giving the standard grading I used as a professor, this calculates to a B- average. Not as good as I would like, but if we were grading on a curve with other forecasters, it is reasonable for a 3+ month prediction.
Winter Outlook Elements
Factors I consider and have written about over the past few months.
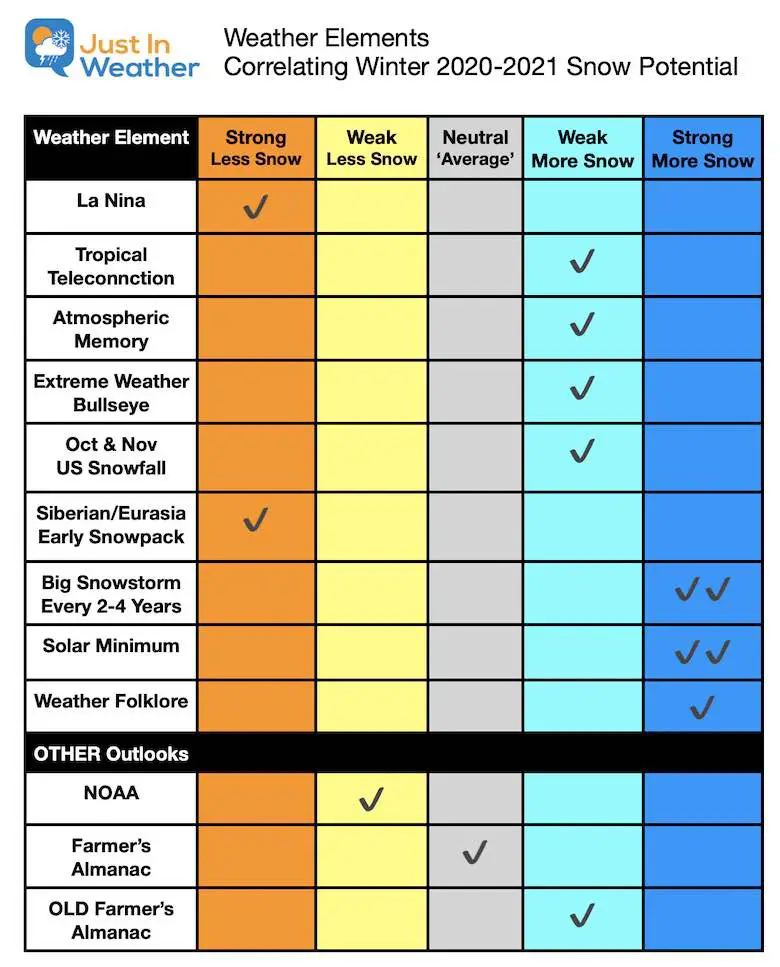
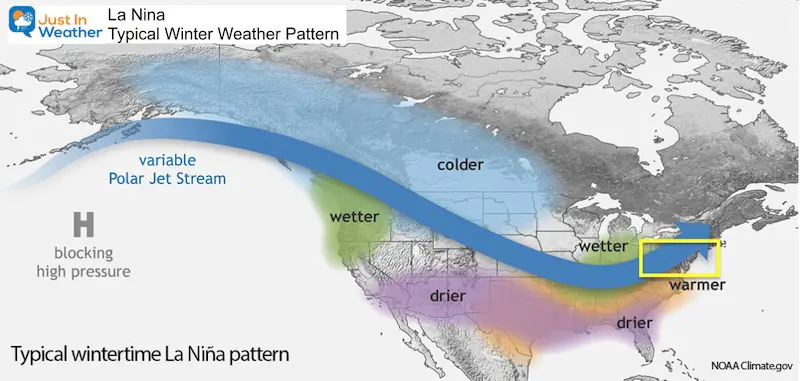
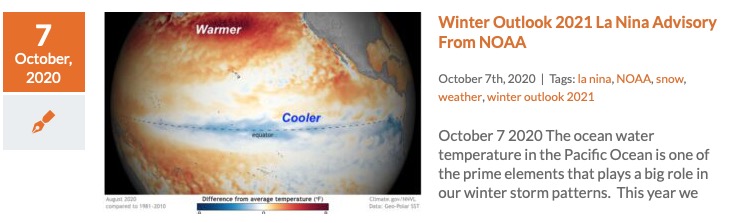
La Nina:
Historically this results in Low Snow for our region.
NOAA and most local forecasts weighted heavily on this alone.
Click the image to see that full report.
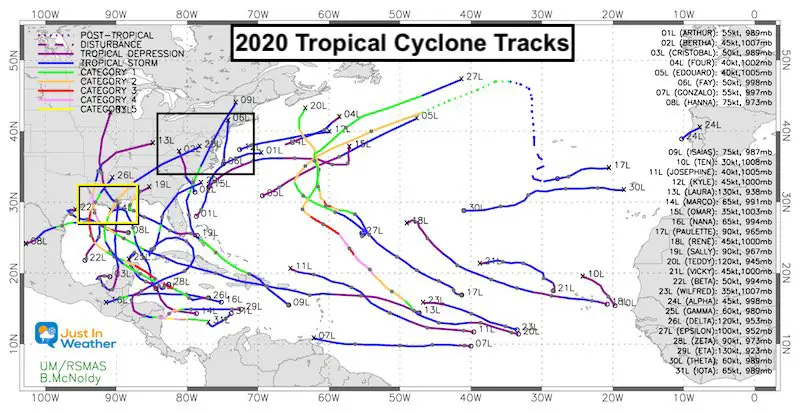
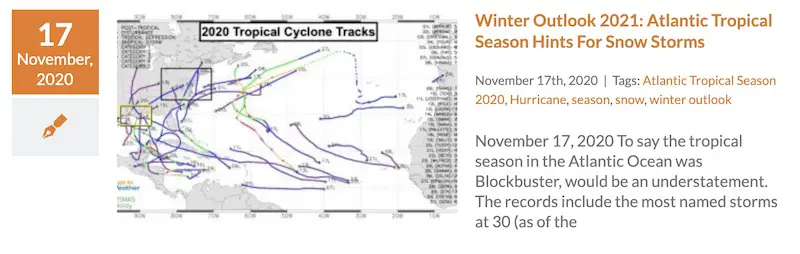
Tropical Season In The Atlantic
Here’s what I determined:
- Cluster Pattern of multiple storms with 2 to 3 week period occurred a few times. In my report I showed the cluster for Louisiana, The Yucatan, and Nicaragua.
- I see another ‘cluster’ pattern again this winter.
- But we had a pattern of tracks through Maryland as well.
- Many southern storms passed south of Maryland or faded south = There will be COLDER tracks for us this winter.
- Many Gulf Coast Storms should originate or grow near Louisiana.
Click the map to see that full report.
Atmospheric Memory
- Two named storms, and one downgraded storm tracked through southern Maryland! Remember St. Mary’s County*
- At least ONE STRONG COASTAL (with cold air for us) may track similar to what Fay did on July 10.
Extreme Weather Bullseye:
- Southern Maryland could see a few Low Pressure centers pass through.
- Those often bring warm rain to southern Maryland, icy mix and tough forecast for central Maryland, and heavy snow in the higher hills and mountains.
- Tornados hit Maryland in a cluster between April 9 to 13. We also have the blow up of storms on September 3. These bullseyes will be considered for trigger points in individual storms as I see fit. Sometimes that can be snow targets, or pivot points of snow/ice/rain lines. I’ve actually showed these in prior years and will bring this up again if it applies again.
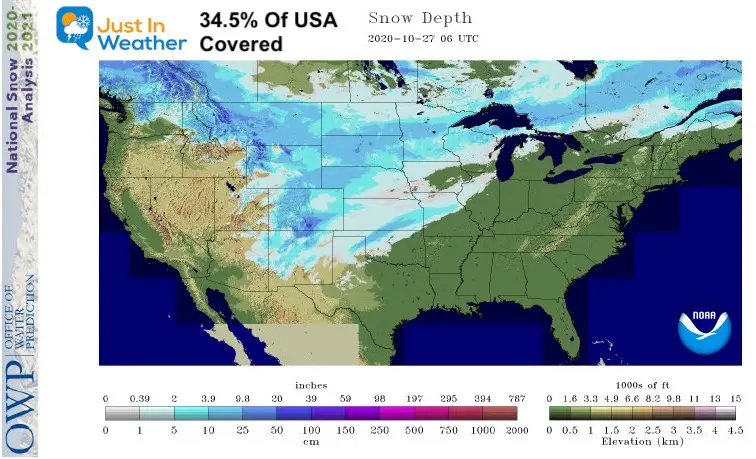
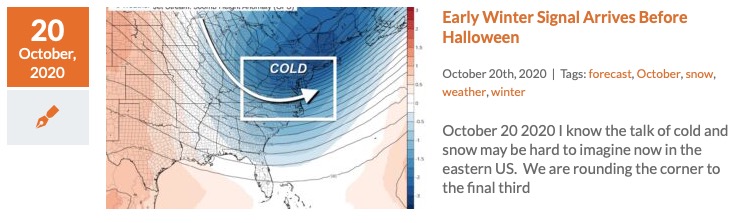
October and November US Snowfall
- Oct 28 = 35.1% coverage. A record for so early.
- Nov 18 = 11.5% coverage.
- That is not the trend snow lovers want to hear about, but it’s not that bad. The energy that brought the early season snow is still in the atmosphere. It will work its way back to the US, and hopefully link up with more prevalent cold air at prime time later in the season.
Siberian/Eurasian Snow Coverage
- October 2020(last month) = 10.96 sq. Km
- October 2019 (last year) = 12.77 sq. Km
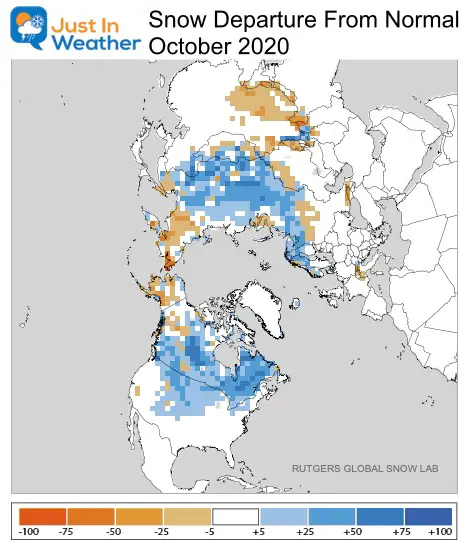
The recent measurement is lower this year. It is likely a reflection of the very low sea ice around the Arctic at the end of summer. This is one reason I expect a delay of really cold air for us and a slow start to winter.
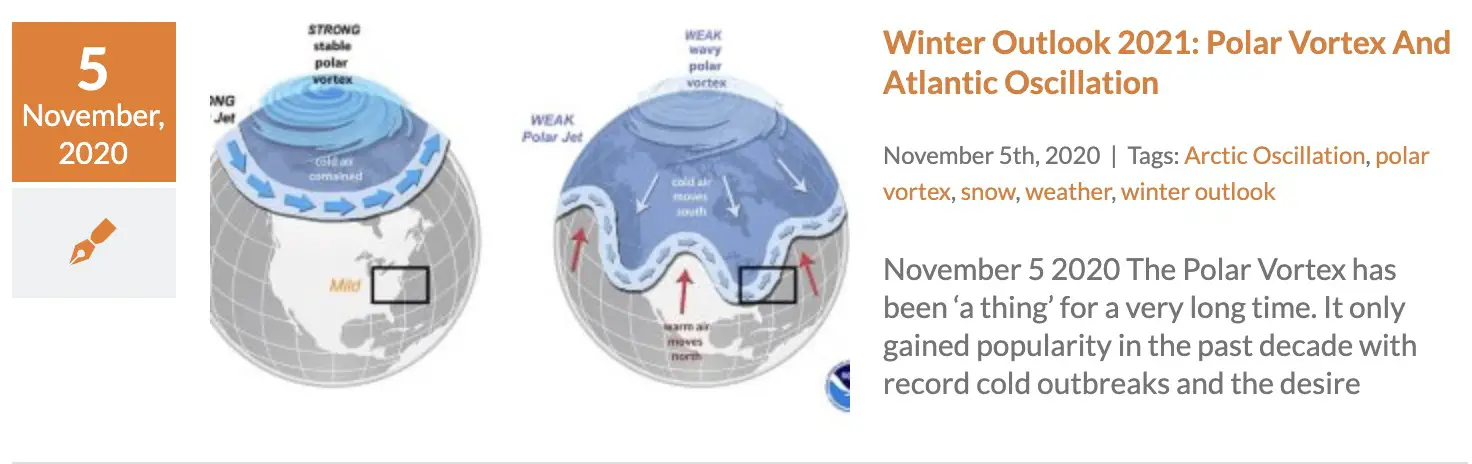
Polar Vortex
This snow in Eurasia can relate to the Polar Vortex (PV). Less snow in that region early in the season, often means a stronger Polar Vortex. That is what happened last winter, resulting in the cold air bottled up in the arctic.
When you hear about the PV, it is often when it is weak and wobbles around the pole, occasionally dropping south and brining brutally cold arctic air. If you want cold and snow, you want a weaker PV.
Click here to see my full report.
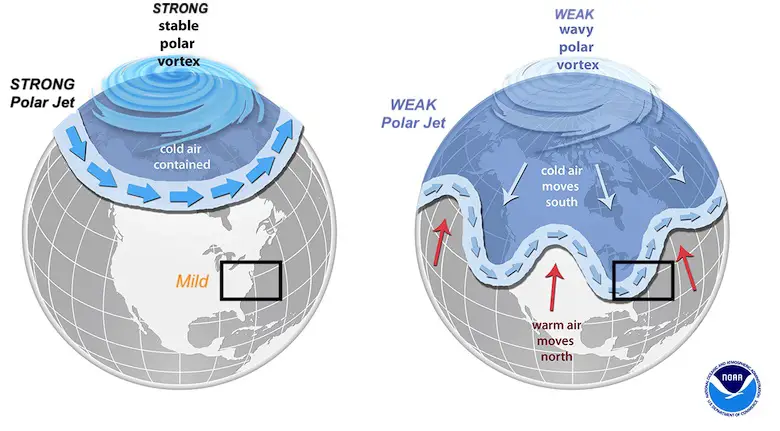
Short Term Forecast: A stronger polar vortex is expected to take us into December. This would keep the bulk of cold air locked up at least for the next 2 to 4 weeks. But some recent modeling suggests ‘blocking’ into western North America, which allow more cold air to drive south. This ‘blocking’ pattern should have a better chance in the second half of winter, resulting in colder air and a more active jet stream.
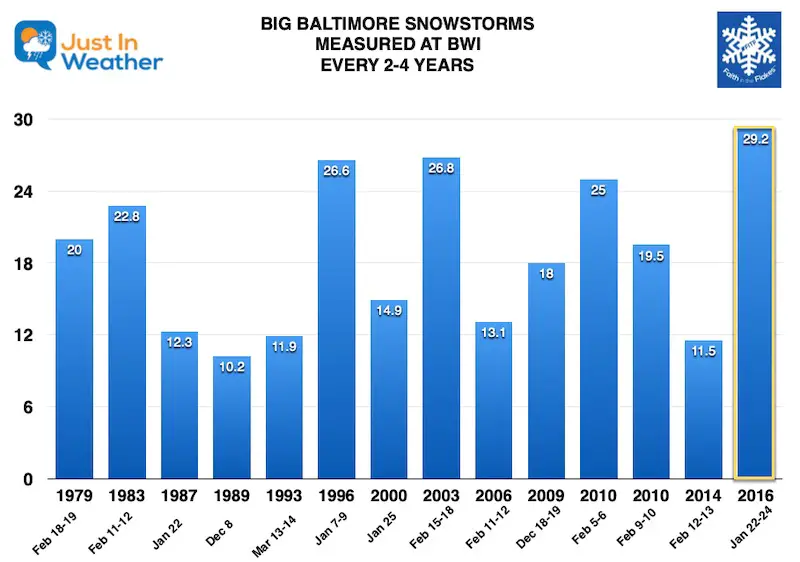
Big Snowstorm Pattern
This chart shows the history of 14 BIG SNOWS in Baltimore every 2 to 4 years since 1979!
The last storm was the biggest on record back in 2016.
That has been quite the pattern for over 30 years! The Law of Averages really pushes the odds in our favor saying we are OVERDUE!
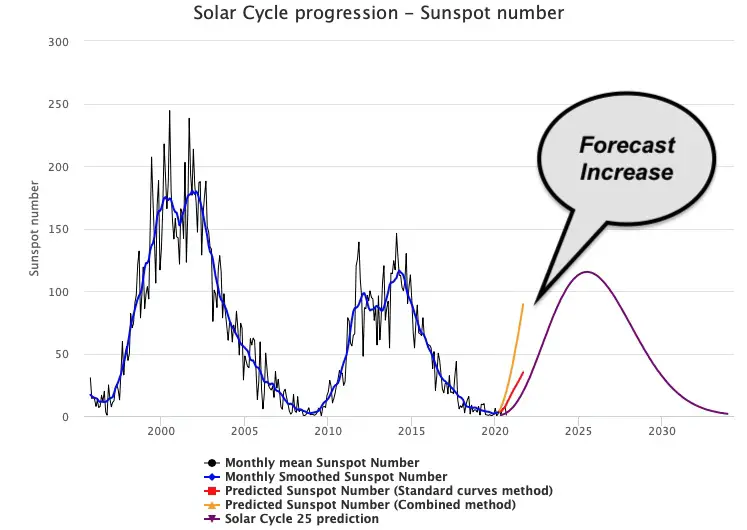
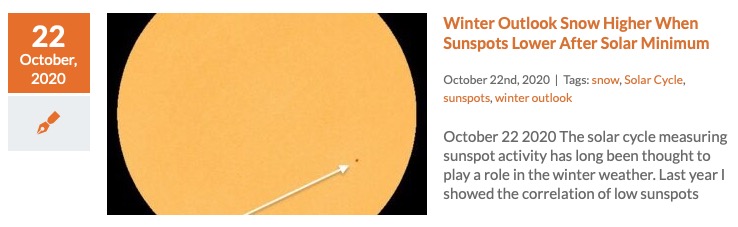
Solar Minimum
I know I mentioned this last winter, but I really mean it this time (as I chuckle). I did further research into this connection, which showed a better chance for high snow historically was in the winter as we come out of the minimum.
*Correlation is NOT causation, but the connection is worth more research.
Click here to see that full report.
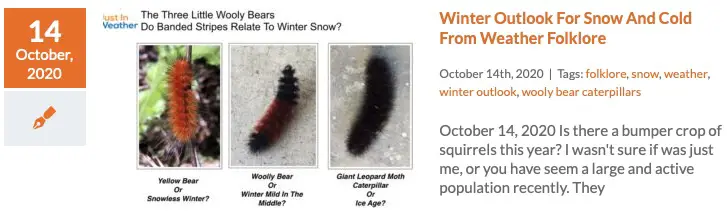
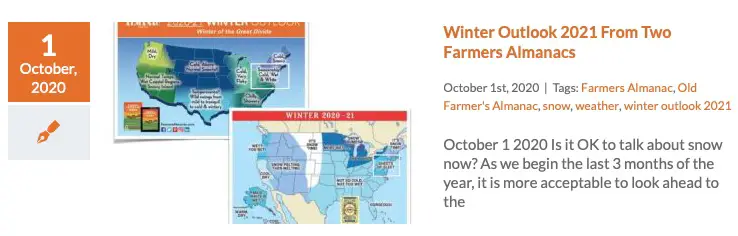
Winter Folklore
- You may have seen fat squirrels or wasp nests high in the trees. There are plenty.
- The most glaring has been: A Warm October = Cold February.
- This past October was 3.6ºF above average, after September had record heat. The flip side or payback could be on the way.
- Did you have flowers blooming recently? We did have an 8 day stretch earlier this month in the 70s. That can be a sign of a bad winter coming’ (or good for snow lovers).
See more Winter Weather Folklore here.
ANALOG Winter 1999 to 2000
Many of us meteorologists like to look for patterns and even past set ups that wee similar to help plan ahead for a season.
I found the winter of 1999 to 2000 to fit to model I was looking for:
- 26.1 inches of snow fell, above the 21 inch average.
That winter had a strong La Nina, and seemed to have a mild and slow start to winter.
It also had the fear of Y2K, and now we have Covid, but that’s another story.
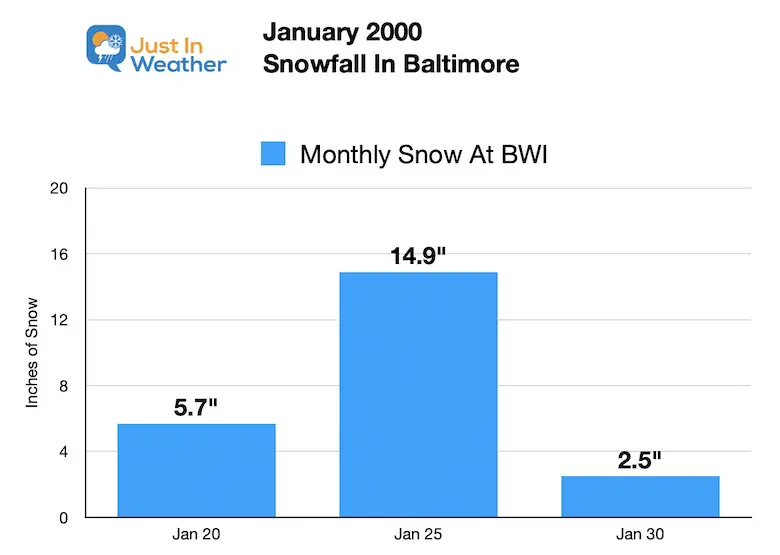
Weather in January 2000 is what stands out!
- MOST OF THE SNOW fell in a 10 day period between Jan 20 and Jan 30.
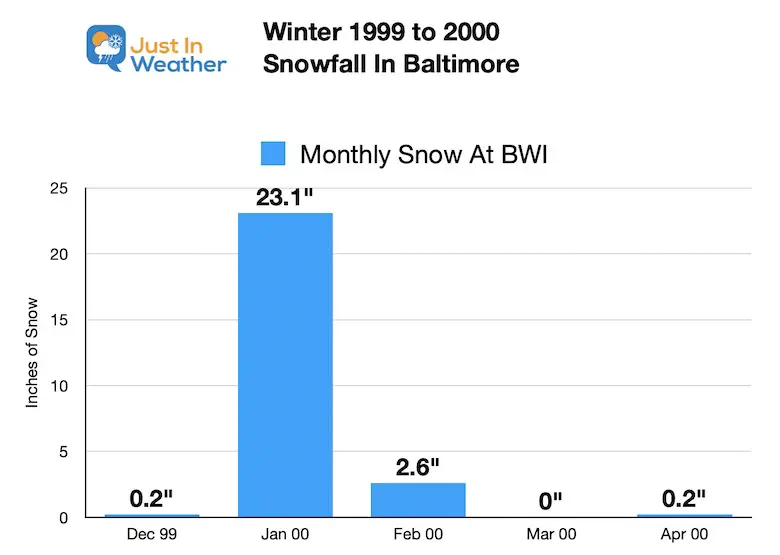
23.1″ of the snow that winter occurred with three storms over ten days!
My take away: I am NOT promising that this is how our winter will play out precisely. But given a similar environment, we can end up with above average snow in a mild winter. That is why the La Nina based or NOAA based mild winter can be deceptive.
I should also note that in 2016, we had that blockbuster 29.2″ snowstorm in January that accounted for 80% of the snow that winter in just one event. I am leaning towards a cluster of events close together. But still wondering if we get that set up once or a few times.
What I will look for:
La Nina AND a strong Polar Vortex will bring a mild start to winter. We will have cold shots in December, but the average for the month is likely to be above average.
BOTH of these elements should weaken, unleashing more cold and snow on the back half of winter.
Most notably will be blocking in the polar jet, allowing arctic intrusions south. This is when we will see fluctuations wide temperature swings are stronger storms. Look for me or other Meteorologists to discuss ‘negative’ Arctic or North Atlantic Oscillations. Also look for big swings of temperatures across the US where one coast is warm, while the other is cold. That is a signal of an active jet stream.
Should we end up on the colder side of these storms… there will be opportunities for snow (or ice).
Storms we do ‘get’ may be two or three within a two week period. Whether this happens once or a few times will be a wildcard.
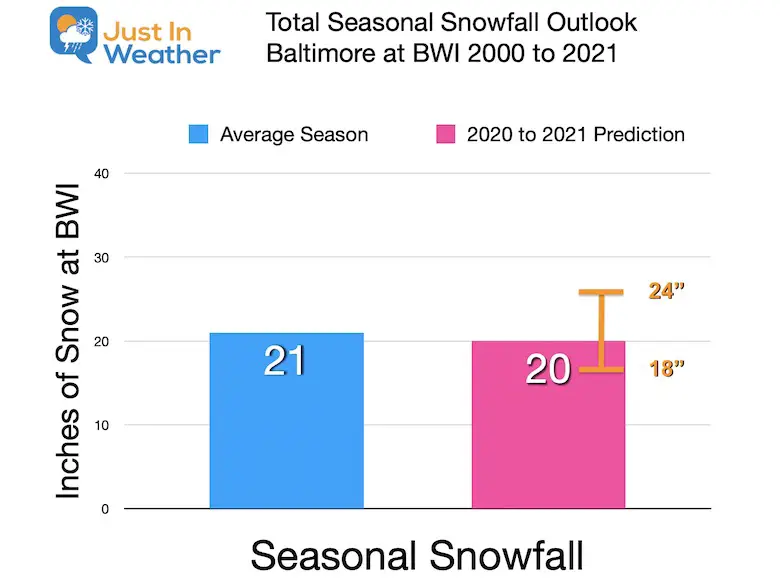
My Forecast for Baltimore at BWI
- I picked a round number of 20 to be near normal.
- The range or margin for error tilted to the higher end (18″ to 24″)
Snow Map for region
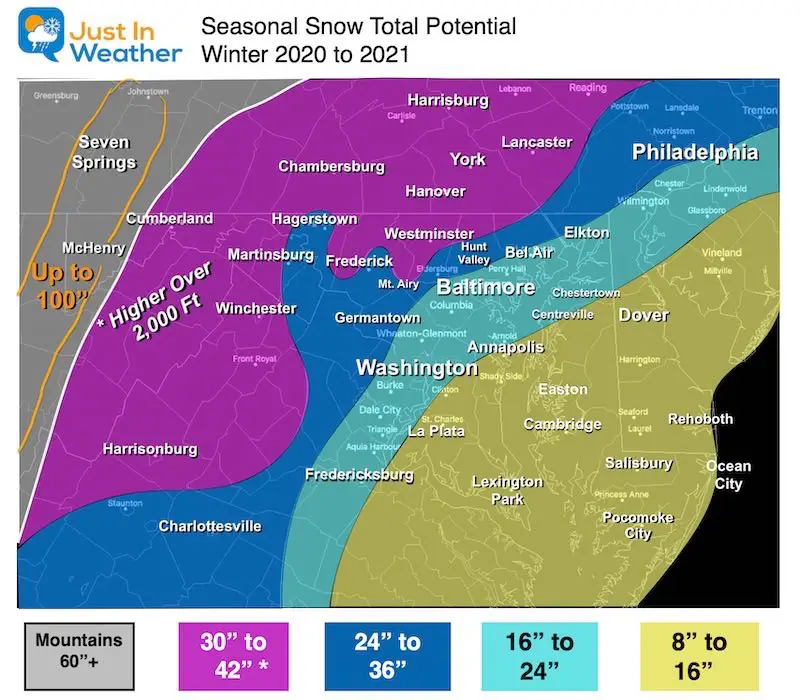
Metro Baltimore, Washington, and along I-95:
16″ to 24″ (less by the water)
This range allows for variations with the region as we often see with individual events.
Due to the warm water, this would be mostly on the back half of winter when the water cools.
Northwest Suburbs:
24″ to 36″
Farther Inland, Lower Ridges and Southern PA: Elevation above 600 Ft
30” to 42”
Since this is away from the water and colder in higher elevation, some earlier season snows are more possible here.
Southern MD/E.Shore:
8” to 16”
Due to the warm water, this would be mostly on the back half of winter when the water cools.
Peak Mountains of Garrett Co and West Virginia
80” to 100” is actually close to normal here.
Quick Temperature Notes:
December: Milder than average.
We will have a few ‘colder than normal’ days. If there is snow, it would come with these brief cold pushes, and more likely farther inland.
January: Near Average
- This is when we look to break down the mild pattern. It’s been a recent trend during this month we wait for the real arctic air.
- I expect strong surges of arctic air starting to show up.
- Climate data shows the coldest time of the year is the 2nd and 3rd week of this month.
- February (into March): Slightly Below Average
- If the Polar Vortex breaks down and wobbles south, this will be the most likely time.
- If we get clusters of storms, this would be when I expect it, even lasting into March.
- Doesn’t it seem like many of our recent winters have lasted later? Except this past year.
Winter Storm Opportunity Windows:
This is new for me, but I am testing a hypothesis. Just putting it out there for fun.
Smaller Snow Chance: Dec 14 or 28
Larger Storm chance
- Jan 13 (plus or minus 2 days)
- Jan 28 (plus or minus 2 days)
- Feb 11 (plus or minus 2 days)
- Feb 26 (plus or minus 2 days)
*I know I did not go with the classic Presidents Week
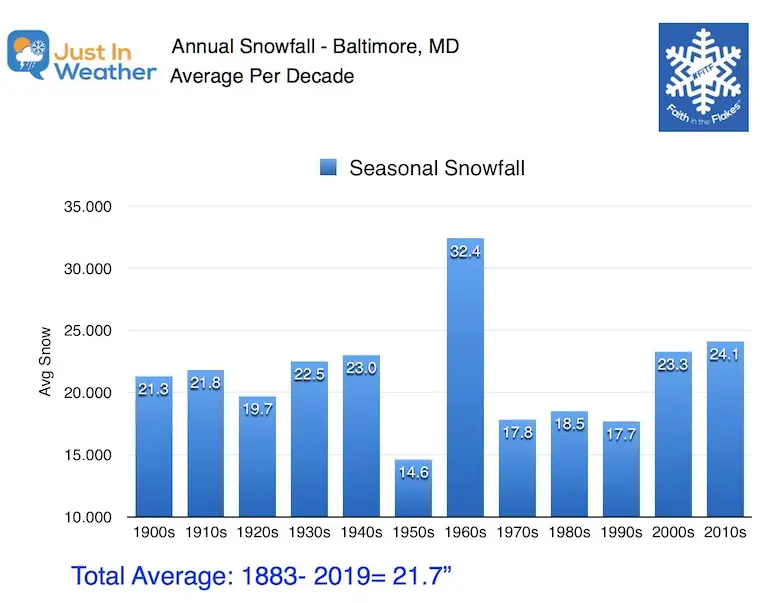
Snowfall History
It does still snow here! The last few years may have you forgetting it, but the last two decades have actually trended above the long range average in Baltimore.
Faith in the Flakes.
FAITH IN THE FLAKES STORE OPEN
My ‘bonus’ daughter Jaiden is showing off our popular Maryland Hoodie. Click here to see this and many other new items.

New Colors
We are giving 10% of each sale to Just In Power Kids: Providing FREE holistic care for pediatric oncology patients.

Please share your thoughts, best weather pics/video, or just keep in touch via social media
-
Facebook: Justin Berk, Meteorologist
-
Twitter: @JustinWeather
-
Instagram: justinweather
Email Updates
Please make sure you sign up (above or click here to sign up for email alerts…. ) for my newsletter. This way you will get an email to make sure you are notified of each post.
Winter Outlook Series
14 Local Maryland Pages (and York PA)
We have made a page for Maryland Weather which gives you the current conditions for 14 present area locations.
Maryland Weather Page
I wanted to keep it simple. Just the basics for a quick view at any time.

Typical First Frost and Freeze

Just In Power Kids:
Proceeds go to our programs Providing FREE holistic care for kids in cancer treatment and up to 5 years post treatment and caregivers.
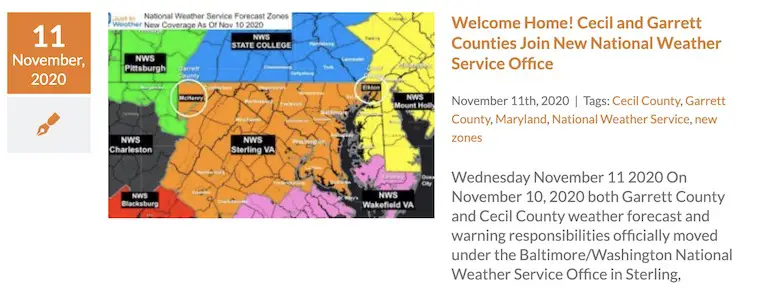
![]()