September 26 2019
Even with a few showers, the lack of substantial rain in the past week has changed the US Drought Monitor map into action for Maryland. A Moderate Drought is now reported for about 1/3 of the state with 32.77% reporting those conditions.
Here is the US Drought Monitor report released today, but conducted two days ago. See the Northeast and Virginia maps below.

What this means:
- Irrigation use increases; hay and grain yields are lower than normal
- Honey production declines
- Wildfires and ground fires increase
- Trees and landscaping are stressed; fish are stressed
- Voluntary water conservation is requested; reservoir and lake levels are below normal capacity
Compare To Our Record Year of 2018
Just one year after record rain in our region we now have a growing drought. It is quite common in the historical records to find extremes from one end to the other with sharp contrast to balance things out. Just ask farmers who often have something to say about the weather. Record cold can be followed by very warm, and vice versa. In the winter I’ve seen huge snowstorms followed by big warmups and melting a week later, or really warm temps followed by a blizzard within a day or two.
In this case, we went from the wettest year on record in Baltimore, to a growing drought. Rainfall for the year is actually above average. But this month, we are only a fraction of where we should be. Check out these numbers for to this point in September:
Rainfall For September 1 – 25
Compared to an average September in Baltimore where BWI should record 2.15″ of rain, this year has 0.07% of that with 0.15″. Last September this this date BWI had 7.25″ of rain, more than 3 times above average.

If you split last September with this month to date, we would still be above average for both months.
Considering the recent heat (records and accuracy at BWI is still under debate), the soil and ground moisture has dried out to a point of concern.
Compare The Summer And Year To Date
The dry weather pattern really took hold this summer. Considering June 1 through Wednesday, we can see that BWI received 9.21″ of rain, under the climatological average of 13.84″. Last year really stands out with the bulk of rain in that soggy summer and 32.61″ rain fell at the airport. Many people have argued a lot more fell in the surrounding areas.
Last week I had the wrong numbers to date. For this year the rainfall of 27.24″, which is lower than the 30.87″ expected to date. The water table, reservoirs, and Bay are doing OK. It is the ground or soil moisture that is the concern.

Drought Condition Maps
Virginia: 53.44% in Moderate Moderate Drought

Northeast US

Outlook
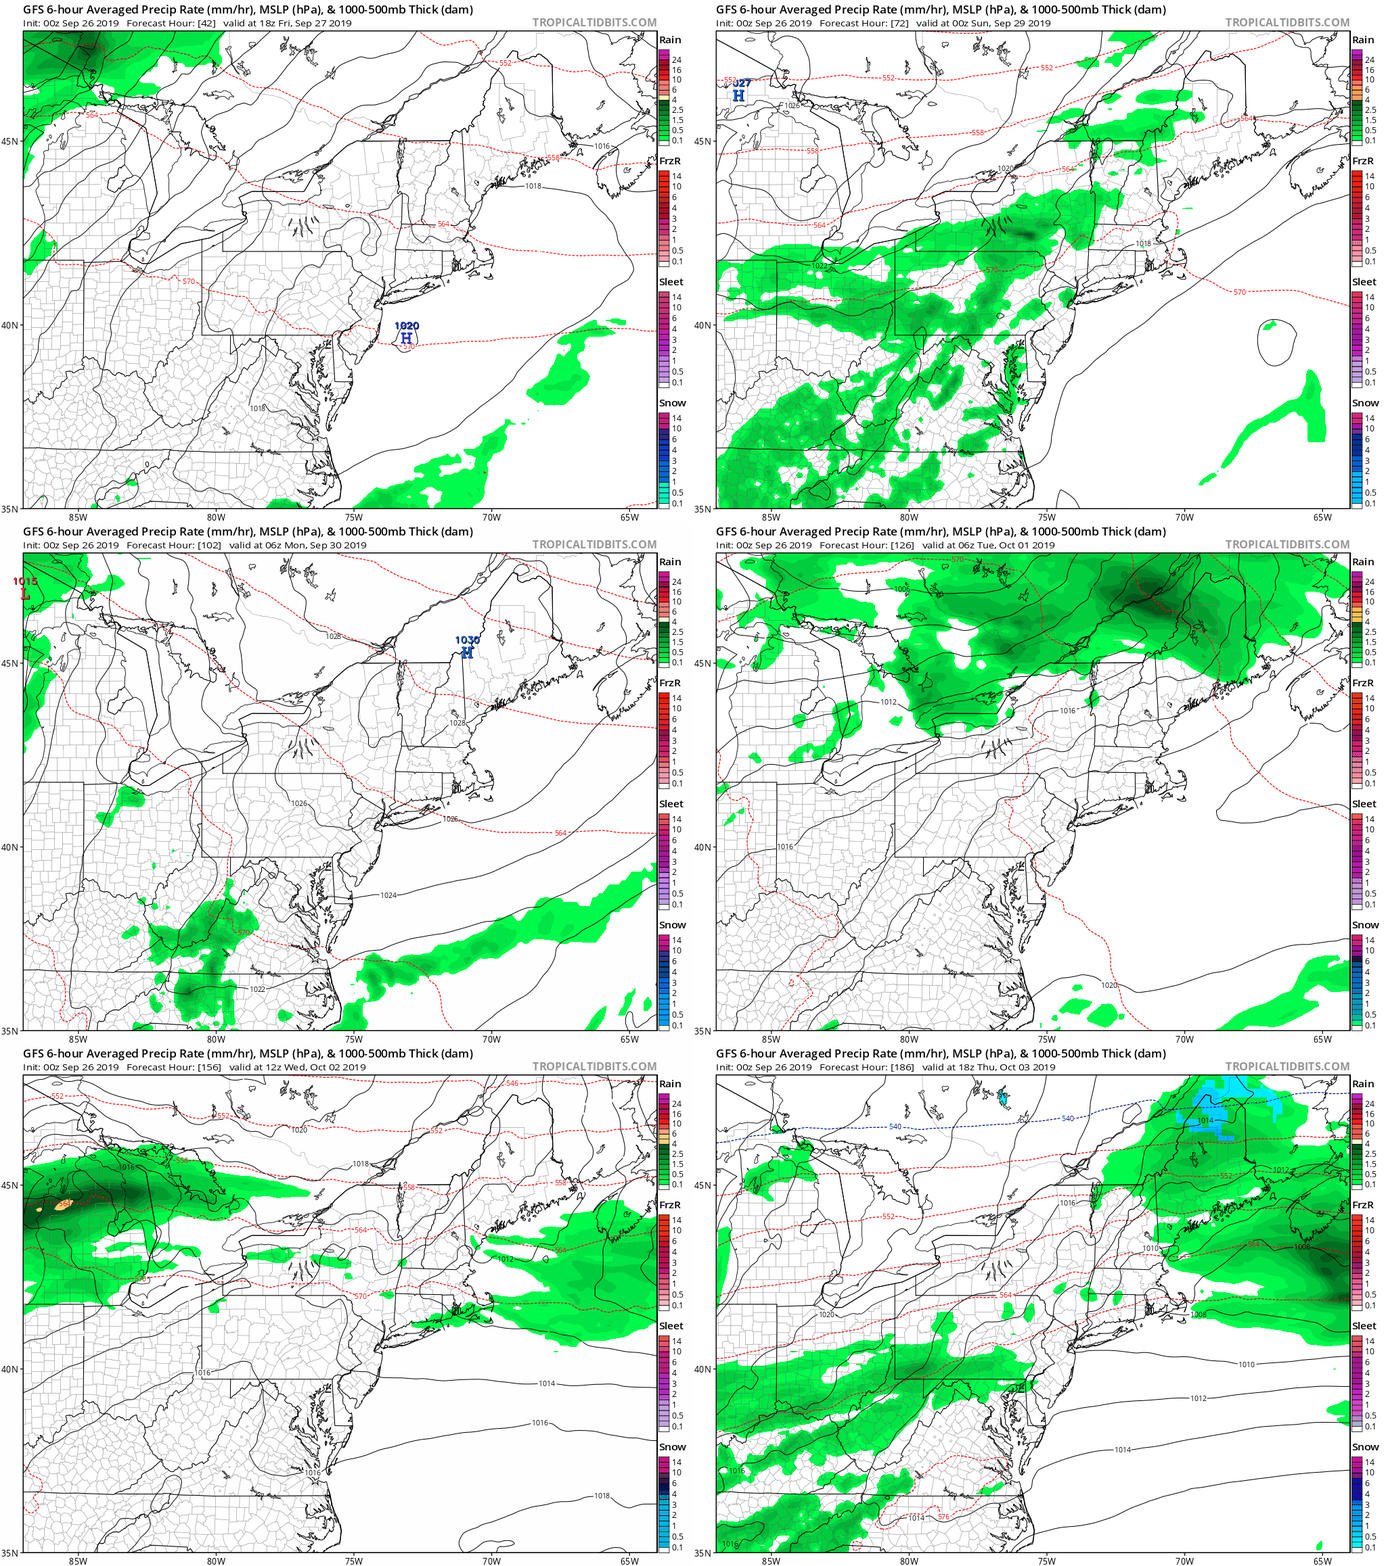
Not much rain is expected in the next week. Barring some showers this weekend, we may have to wait until the end of next week for another chance of rain.
Pattern Change
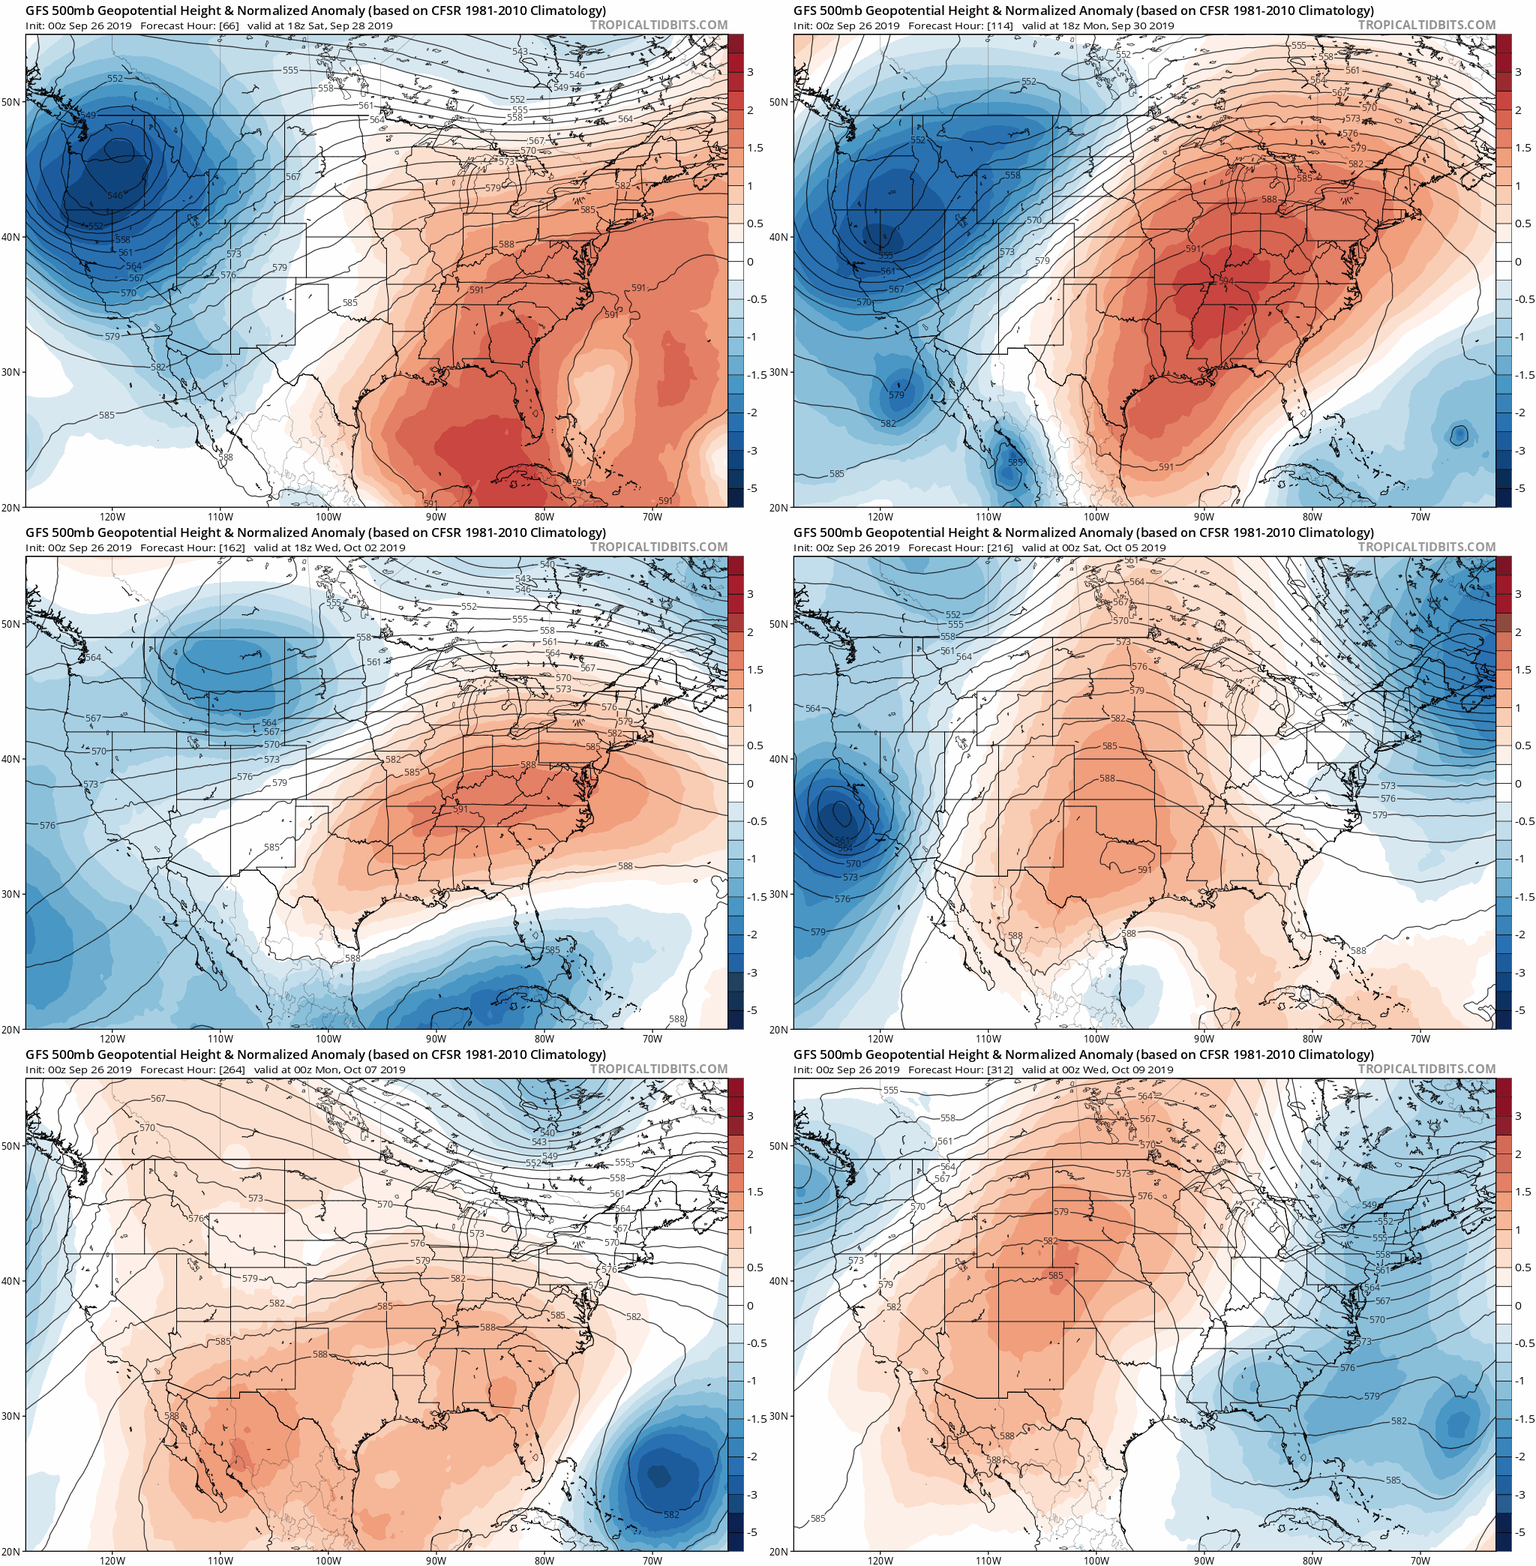
The jet stream continues to lock in the ridge of warm air in the east, while colder and stormy weather will dominate the western US. There will be repeated snow events in the Rockies.
But the change we hope for may arrive between October 8 and 10.
Please share your thoughts, best weather pics/video, or just keep in touch via social media
-
Facebook: Justin Berk, Meteorologist
-
Twitter: @JustinWeather
-
Instagram: justinweather
Maryland Trek Cycle Jerseys From Hill Killer
All proceeds will go to the Maryland Trek 6 total and Just In Power Kids programs
Just In Power Kids:
Proceeds go to our programs Providing FREE holistic care for kids in cancer treatment and up to 5 years post treatment and caregivers.

Shine On
Proceeds from all sales go to Just In Power Kids. Click the image to shop and show your support.
Love Maryland Shirts and Hoodies
This shirt was designed by my ‘bonus’ daughter Jaiden. The hoodie has been the biggest hit, so our promotion has been extended until the end of this week.
|
||
|
Show your love for Maryland and make this 14 year old artist and her mom extra proud
|
Related Links:
Baltimore Weather At BWI May Not Be As Hot As Reported
Construction at the airport close to the weather station may be added artificial heat. Click the image for the details.


