 October 29 2018
The sun has been very quiet lately. It may look the same to us (never look at it directly without protection), but there is weather and activity on our star. The sun has a clearly defined weather pattern of spots increasing and decreasing. These are storms and they can release more energy through space that reach Earth.
There has long been speculation and some research that there is a connection of sun spot activity to weather on our planet. What’s important to this winter is the very low solar activity. In science it is important to note the correlation is not causation. But, the connection of solar activity to our local snowfall ( using historic records in Baltimore) is too strong to be ignored.
The data supports that when sun spot activity is low, then we often get more snow. This report is not my formal winter outlook. However, it will be part of my assessment for what the season of snow may have in store for us. This is not the only factor into our winter, but if you have Faith in the Flakes, you may want to check this out. It’s worth the read. But you can skip towards the bottom with a chart putting it all together. FITF
Solar Cycle: Counting Sun Spots

Spots on the sun are essentially solar storms. The cycle starts when the solar activity is low, a few years later it peaks, then settles down again. This repeats roughly every 11 years. Here are the highlights:
- Records of solar cycles date back to the 1700s. Since then, the cycles can range from 9 to 14 years.
- In the past 300 years, 21 cycles have averaged between 10 and 12 years.
- At the end of each sun spot cycle, the magnetic poles on the sun reverse. So to get back to where it started, a second sun spot cycle will reverse it again.
- We are entering solar minimum again. The current one is in the process of starting over again. After being the slowest activity on record, it seems to be ending early.
I have more about the connection to winter weather in the eastern US below.
NASA Video: Solar Cycle Minimum is Coming (or Here)
SOHO Studies The Sun
NASA’s branch that studies the sun is called SOHO – Solar and Heliospheric Observatory. That advent of modern technology and satellites has allowed for improved monitoring of the sun in the past two decades. Sun spot activity has been easy to capture and compare like this Solar Max in 2001 to the declining activity in 2005
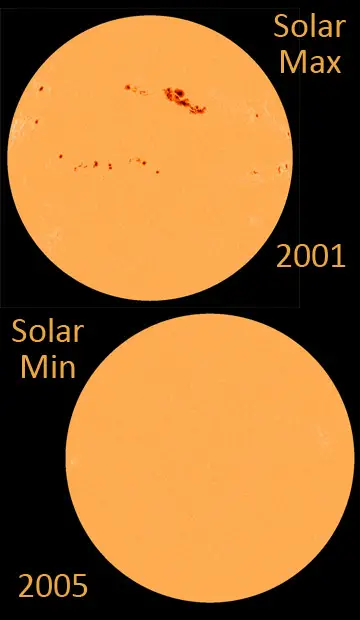
NASA comparing solar images between low solar activity in 1996, high activity in 2001, then low again in 2006. The cycle bottomed out in 2008 and 2009.
Solar Cycles Since 1977

For argument sake, let’s compare the years shown in official NASA charts with the Solar Minimum and Baltimore winter snowfall. It is important to note that solar minimum can last more than one season:
Current Average Snowfall at Baltimore’s BWI is 20.1″
1977
Winter 1977-78 = 34.3″ snow
Winter 1978-79 = 42.5″ snow
1986
Winter 1986-87 = 35.2″ snow
1996
Winter 1995-96 = 62.5″ snow
2009
Winter 2009-2010 = 77.0″ snow (*NWS lowered the total with dispute of FAA measurements at BWI)
Current Sun Spot Cycle
The red line was the latest solar forecast. Note the activity marks show this cycle is ending earlier than projected… 2018 sun spot numbers are comparable to that of 2008 and 2009.

The current solar cycle 24 is appearing to be coming to a close. In fact, there is a delay in the data and it may have already bottomed out. In 2008, there were 268 spotless days. We went 32 of 33 into the end of July without a single sunspot. as of October 29th, there have been 20 days without a sunspot. It’s safe to say that if we are not at a minimum, then we are heading there.
It’s also important to note that each solar cycle in the past four decades has decreased in activity.

Solar Cycle And The North Atlantic Oscillation
Peering through the weeds of research, I found an article from the Academy of Finland and University of OULU relating sun spot activity to The North Atlantic Oscillation. First, here is a refresher about what The North Atlantic Oscillation is.. If you are a weather nut, then you may remember me or other forecasters talking about this a lot during the winter.
The North Atlantic Oscillation (NAO)
This is an important semi-permanent pattern in winter that can adjust the jet stream. It can determine if the eastern US is warm or cold and stormy. The NAO index measures the location and intensity of the Icelandic Low and North Atlantic High Pressure systems to give a positive or negative value. It looks for blocking that can buckle the jet stream and send cold air down form the arctic to eastern Canada and the US.
Positive (NAO+) = warm for the Eastern US
Often this means less snow and milder winters in the Mid Atlantic and New England.

Negative (NAO-) = cold and often stormy for the Eastern US
Often this brings in more snow and bog Nor’easters to the Mid Atlantic and New England.

For example, here is a look at the NOA Index recently with the forecast from the European (ECMWF) Model. The plot shows old forecasts since Oct 19 and the current outlook. The positive numbers correlate to when it was mild for us. The negative numbers relate to recent storms and colder temperatures.

- On October 23, when NAO was almost +2, Baltimore hit 70ºF.
- In contrast, the October 26 storm correlated to the NAO -2.3. On that date, Baltimore only hit a high temperature of 49ºF.
Forecasting the NAO is one way we can have a better handle on long terms warm or cold spells. It also can often, but not always show a likelihood of storms for the eastern US.
Much of our past few winters were dominated by NAO+. We have been expecting a winter with more NAO- and this year might do that.
Back to the research from Academy of Finland and University of OULU… They connected NAO+ to declining phase of the solar cycle. Basically just after the solar maximum, there is a tendency for NAO to be in the warm or positive phase. That could explain much of the past 3 winters being warm with low snow. In fact since 2014, we have had below snow with the exception of the record epic snow in January of 2016. The rest of that winter was snow free.
The contrasting minimum solar activity is only briefly touched on. But, it deserves more scrutiny…
When Sun Spots Are Low There Should Be Negative NAO (and more snow)
I must refer you to the NASA video above and scroll to the 2:46 mark.
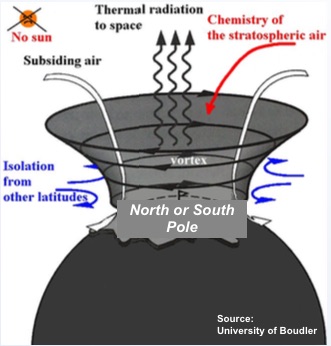
During Solar Minimum, the upper atmosphere cools… The NASA video related this to drag on satellites, but it has an impact on our weather as well. Do you remember the Polar Vortex?
A cooler upper atmosphere will allow more thermal radiation (heat) to escape into space. That would allow for stronger Polar Vortex and thus could enhance the NAO Index.
Back to the NAO
This is the charting of the North Atlantic Oscillation since the late 1800s.

Now Lets Put It All Together
This chart is a simple comparison of years documenting Solar Minimum, North Atlantic Oscillation, and Snowfall in Baltimore. Again, correlation is not causation, but there is a very strong connection here.
Baltimore average winter snow is 20.1″
NAO (Blue = Negative); (Red = Positive)
Snow (Above average = Blue); (Red = Below Average); (Gray = Near Average)

Notes:
- 15 out of 20 years around the Solar Minimum had above average snow.
- 4 years hd near average snow and 1 year was well below average.
- Average of 37″ snow in winters close to Solar Minimum years. That is almost double the long term average.
- There are some exceptions to the rule here.
- Some years such as 1903-05 the NAO+ still translated to above average snowfall.
- NAO can fluctuate throughout a season. The charts show the average for the season. But there can be NAO- and storms in an overall NAO+ season.
This is on over simplification just to show the connection and not bore you. Since you made it this far in my explanation I must thank you. I have cross referenced these years with ENSO and most occurred in El Nino years.
I am including this data along with others for my formal Winter Outlook. That will be ready this week.
Long Range Solar Cycles

There is a theory that there is a longer cycle of the sun that can relate to global climate. The Maunder Minimum occurred at the time prior to the US Revolution. This is marked by extremely hard winters and shifting of farming from northern latitudes in Europe. There is growing support that the recent slow solar cycle may lead to an extended period of hard winters and perhaps global cooling.
Modeling shows lower solar activity for the rest of this century.

Also see:
Winter Outlooks
Will A Wet Summer Bring A Snowy Winter?
El Nino Modoki May Enhance Snow Chances
Winter Outlook From Two Different Farmers Almanacs
NOAA Winter 2018-2019 Outlook Explained: This Actually Supports Snow
Cold Stuff
Normal First Frost/Freeze Dates
Maryland Winters: Snowfall by region and records
FITF and SnowStix Stores are now OPEN
FITF Gear: Store Open Early By Request

Snowstix- We Need You To Measure Snow Too
We are giving 10% of each sale to Just In Power Kids: Providing FREE holistic care for pediatric oncology patients.

Keep In Touch Every Day
Click here to sign up for email alerts…. Just in case you don’t get the post on your social media feed
Please share your thoughts, best weather pics/video, or just keep in touch via social media
-
Facebook: Justin Berk, Meteorologist
-
Twitter: @JustinWeather
-
Instagram: justinweather