 Hurricane season in the Atlantic is from June 1st to November 30th, and peaks during the second week of September. In the Pacific along the Americas it begins on May 15th. A storm must first reach above 39 mph to be classified a Tropical Storm and get named. Just getting a system to form means that the water is roughly 80F among other conditions. The historical significance of this helps different areas to prepare or plan for certain times of the year. See the historical origin maps and videos tracking the record 2005 season.
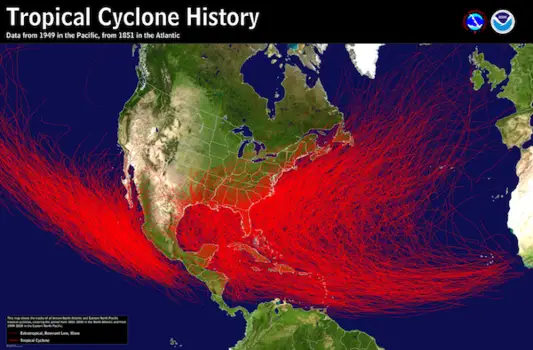
The maps in this slide show below break down the locations for tropical storm formation. Each map represents a 10-day period with historical plots for development. This begins on May 10th, almost a month before the typical season begins. Every eight to nine years a storm does form in May, with 18 identified on these maps. If it were to happen, the Caribbean Sea would be the ‘most likely’ spot to look.
Historical time of the formation of tropical storms and where this occurred. Data for the Atlantic starts from 1851, Pacific in 1949. Source: NOAA, National Hurricane Center
In June, warm water and better conditions spread to The Gulf of Mexico, with a handful of storms off of the southeast US coast. But as summer draws near, the main early season is considered to the along the Inter-Tropical Convergence Zone in the central and eastern Atlantic near the Cape Verde Islands, located off of Africa’s coast. There are few plots, in part due to the lack of solid reports earlier in time. But one thing that is hard to argue is the increase in expected storms into early fall. Most storms will form between August and early October, however the peak activity is centered on the season week of September. This is when tropical waters tend to be at their warmest, a lag of almost three months after the strongest sun angle of the year.
In an average year with 11 named storms, here is the breakdown of when the storm total would tally up:
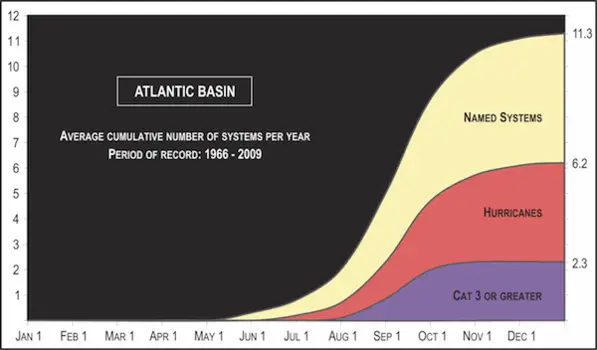
- July 9
- August 1
- August 13
- August 23
- August 31
- September 8
- September 16
- September 24
- October 4
- October 19
- November 23
For the Atlantic, there are extensive records dating back to 1851 thanks to ship records. But it is not perfect. The satellite era dramatically improved upon the awareness of storms in the open water. The Pacific Ocean database is less extensive, beginning in 1949.
Tracking With NASA
The record 2005 season has 21 names storms, with the last one Zeta extending past the end of the calendar year, although it was closer to Europe. It should be noted that there is a 30 year cycle of high and low activity in the Atlantic, and the years that followed decreased. The 2013 season was the least active matching 1982 with only two hurricanes. It was the first since 1994 with no major hurricanes (Category 3 or higher).
Video of 2005 Atlantic Season
Satellite Video Of Katrina
Related Articles
History Of Naming Tropical Storms and Hurricanes
Please share your thoughts, best weather pics/video, or just keep in touch via social media
-
Facebook: Justin Berk, Meteorologist
-
Twitter: @JustinWeather
-
Instagram: justinweather
Keep In Touch Every Day
Click here to sign up for email alerts…. Just in case you don’t get the post on your social media feed
 Get the award winning Kid Weather App I made with my oldest son and support our love for science, weather, and technology. Our 3 year anniversary of the release and our contribution to STEM education is this November. It has been downloaded in 60 countries, and works in both temperature scales. With your support we can expand on the fun introduction to science and real weather.